A New "First" For Bitcoin
Investors,
Cubic Analytics has officially crossed 4,000+ subscribers — an important milestone for the newsletter! To everyone who’s been part of the journey so far, thank you for your continued support and help to spread the word about my research.
To celebrate crossing the 4,000 milestone, I’m happy to offer a 40% discount link for premium memberships:
As a premium member, you’ll join 250+ investors who receive the following reports in addition to free weekly research (like this report):
A weekly report focused specifically on the stock market & crypto. These deep-dives highlight advanced market metrics, trends, statistical studies, technical analysis, and interesting charts that are vital to know and understand.
A monthly deep-dive on a stock that you get to vote on! The next edition will be published on 3/1/23, where I’ll be covering Meta (Facebook) $META. These reports are an unfiltered analysis to explore the qualitative and quantitative investment thesis of the company.
Full access to the “Portfolio Strategy” series, where I shared the 15 individual stocks & ETF’s that I’m buying in portfolios that I manage and consult for. This series explained how I’m putting my overall investment thesis into action and shares how I’m investing within my own portfolio.
33% discount for 1-on-1 hourly meetings! Substack recently launched the ability to schedule 1-on-1 meetings, where you can ask me direct questions about the economy, the stock market, individual stocks, career advice, literally anything. At the present moment, I’m offering these meetings in two tiers:
$50/hr for premium members
$75/hr for free members
If you have any questions, please reach me directly at calebfranzen@gmail.com
Macroeconomics:
Economic data was extremely thin, absent of meaningful updates for inflation, the labor market, or Fed policy. Jerome Powell was interviewed at the Washington Economics Club, but he predominantly repeated the sentiment that was expressed during his FOMC press conference. Essentially, it was a nothing burger.
Even with the absence of significant economic data, markets continued to digest the “higher for longer” narrative and yields rose across the maturity spectrum in a meaningful way. The 5, 10, and 30-year Treasury yields all broke out above important resistance trendlines, shown in the charts below:
5-year Treasury yield = 3.93%
10-year Treasury yield = 3.743%
30-year Treasury yield = 3.827%
The yields on these maturities are all inverted, meaning that shorter-term debt is yielding a higher interest rate and therefore betraying a core principle of finance: the time value of money. The yield curve is historically inverted, in fact, highlighting how deep we are into the twilight zone.
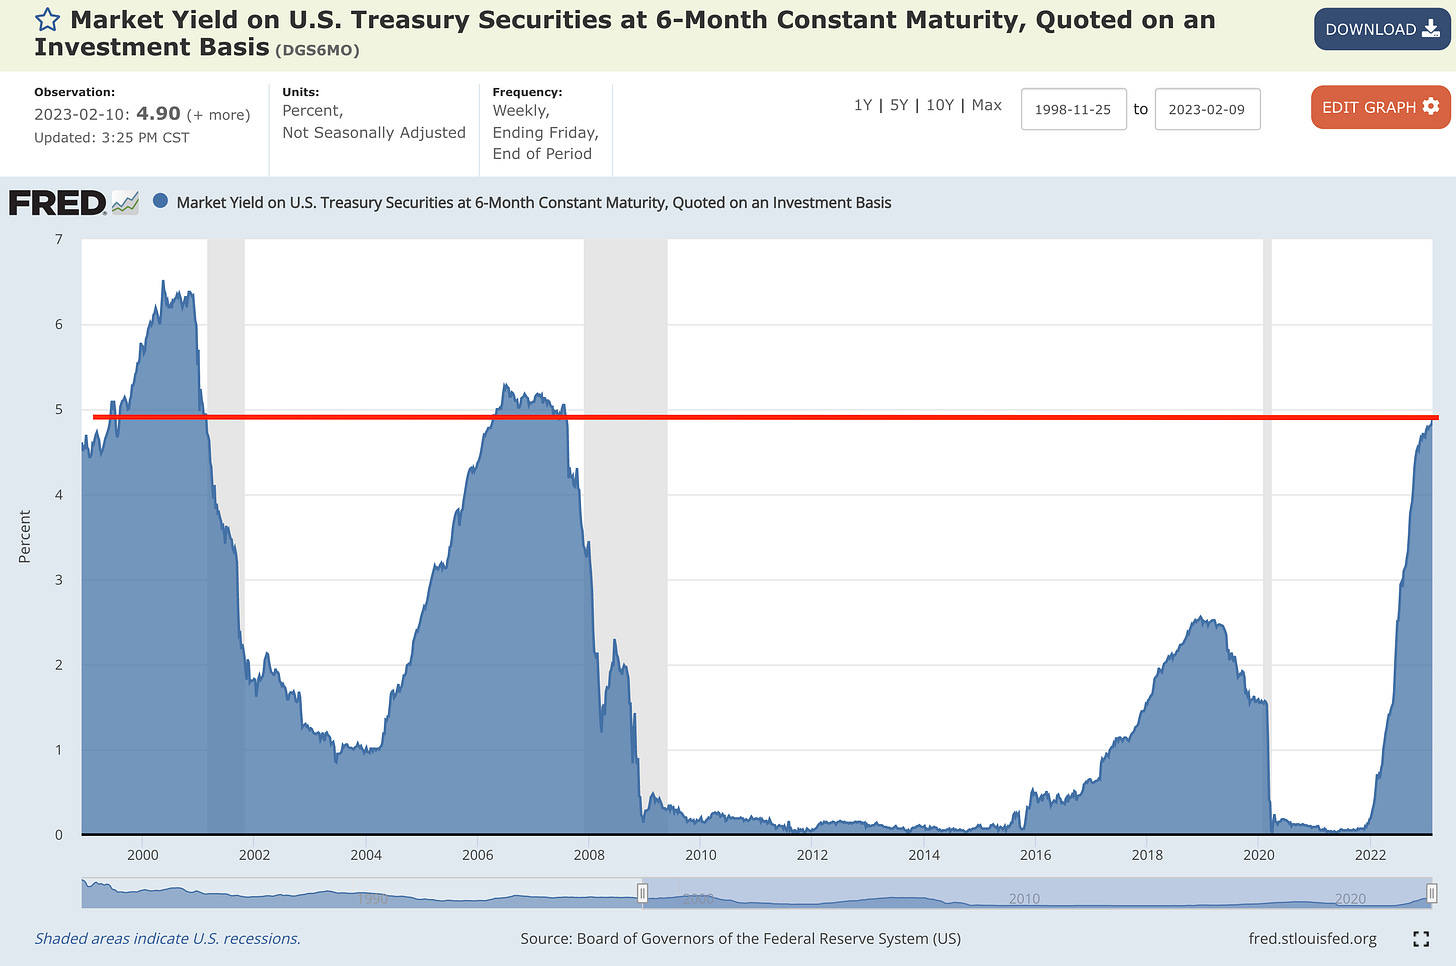
Yields on debt with a maturity less than two years remain extremely elevated. I’m closely monitoring the 6-month Treasury yield, which is currently yielding 4.926%!
Personally, I think short-term U.S. debt is offering some of the most attractive “risk-free” return in the market. As I continue to be on alert for a recession in 2023, I view bonds with a maturity less than 1-year as an attractive opportunity in the current environment. Investors have the opportunity to generate more than 4.9% (annualized yield) on a 6-month Treasury for the first time since July 2007! In that prior occasion, the U.S. economy was just about to enter the Great Recession and the 6-month Treasury yield would fall to 2.02% by January 2008 and 0.17% by December 2008. Essentially, investors who locked-in those financing terms were rewarded handsomely and I think history could repeat.
Investors have rarely had the opportunity to lock-in yields at such elevated levels, and I think now is a prudent time to be opportunistic. Looking at the 6-month yield over the past 20+ years, we can see that this is a screaming opportunity. Interestingly, steep declines occur just prior to a recession (see 2001, 2007, 2019):
First of all, the 6-month yield isn’t declining yet. None of the shorter maturity yields are! If/when they do, that’s the time to start having immediate concerns about the U.S. economy, which is something I explained on Twitter a few weeks ago:
With relatively resilient economic data, the market is pricing in “higher for longer” and yields are rising across the maturity spectrum. In my opinion, this is allowing investors to secure attractive returns for a relatively minimal risk. For an investor willing to stomach potential fluctuations in the value of their bonds over the next 12 months, they could hypothetically:
Lend the U.S. government $10,000 for 1 year.
Collect an annualized return of 4.9%, paid via semi-annual coupon payments.
Receive their $10,000 back from the government at the end of the 1-year period.
That doesn’t sound too shabby to me.
Stock Market:
In a week where yields and the U.S. dollar increased quite substantially, stocks and risk assets struggled to maintain their hot start to the year. Across the board, U.S. indexes generated a negative weekly return:
Dow Jones $DJX: -0.17%
S&P 500 $SPX: -1.1%
Nasdaq-100 $NDX: -2.1%
Russell 2000 $RUT: -3.36%
Meanwhile, the hottest parts of the market cooled off the most:
NYSE FANG+ Index $NYFANG: -3.3%
Renaissance Greenwich IPO ETF $IPO: -5.7%
ProShares Online Retail ETF $ONLN: -7.5%
Ark Innovation ETF $ARKK: -8.64%
iShares Blockchain & Tech ETF $IBLC: -14.5%
With the bulk of earnings season now in the rearview mirror (70% of companies in the S&P 500 have reported earnings), I think it’s safe to say that S&P 500 earnings were relatively underwhelming. They weren’t bad, but they certainly weren’t good either.
According to data from FactSet, roughly 69% of companies have beat EPS estimates (vs. a 5-year average of 77%), though many estimates had been revised significantly lower over the past few months. Similarly, 63% of companies have beat sales estimates (vs. a 5-year average of 69%). Notably, quarterly EPS growth for the S&P 500 was -9% if we exclude the energy sector! Aggregate EPS growth for the index is -4.9%, which is the worst growth rate since Q3 2020.
Despite the underwhelming results for the fundamental operating performance of S&P 500 companies, I’d argue that the index has managed to shrug off any concerns.
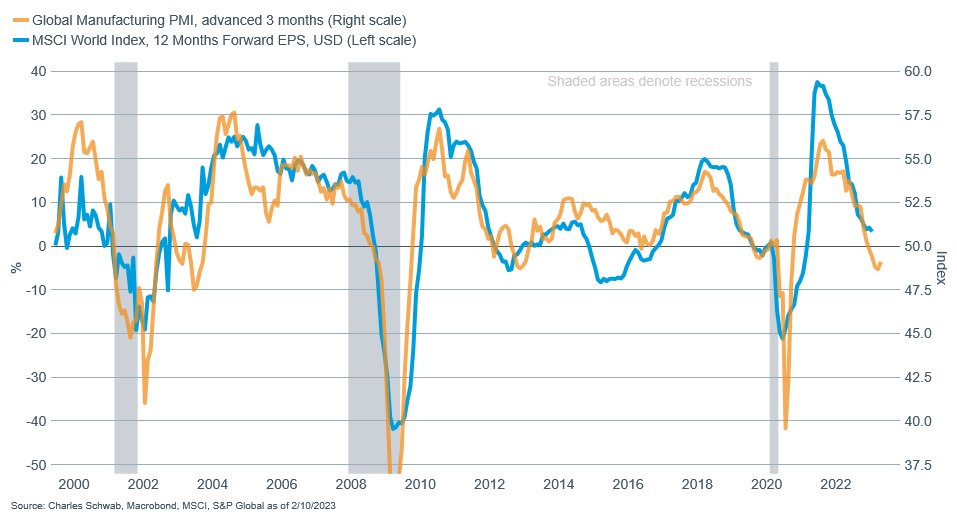
Combining economic data with corporate earnings results, I found the following chart from Jeffrey Kleintop, Chief Global Investment Strategist at Charles Schwab, to be extremely insightful:
If we assume that the historic correlation remains effective, we should expect to see 12-month forward EPS contract a bit further. This fits within my overall expectations, particularly as I retain an underwhelming outlook for the U.S. economy.
Bitcoin:
With the riskiest of risk assets consolidating this past week, Bitcoin and crypto weren’t immune from downside pressure. In fact from the traditional market close in the prior week to the market close on Friday evening, crypto got punished:
Bitcoin $BTC: -7.9%
Ethereum $ETH: -9.1%
Crypto Top 30 Index: -8.5%
We shouldn’t be surprised by this dynamic, particularly if we accept the fact that the broader crypto market is essentially a higher-beta version of technology stocks. With tech struggling this past week, crypto struggled even more. It’s that simple.
It’s been a grueling “crypto winter”, with plenty of first-time achievements and signals occurring for Bitcoin throughout the ongoing bear market. I’m not convinced that the bear market is over and I generally expect the downtrend to continue. At the very least, I expect sideways consolidation.
One particular indicator that I’m monitoring is the relationship between three of Bitcoin’s long-term moving averages:
52-week EMA (yellow) = 1-year moving average
104-week EMA (teal) = 2-year moving average
156-week EMA (red) = 3-year moving average
These EMA’s typically expand during a bull market and contract during a bear market!
Interestingly, we’ve never seen the 1-year EMA (yellow) cross below the 3-year EMA (red)… until now. For the first time in Bitcoin’s history, we’re seeing this exact dynamic take place. Why is this important? It essentially highlights the severity, in terms of time and magnitude, of the ongoing bear market. While many Bitcoin investors have noted that BTC typically bottoms roughly ~400 days after the bull market peak, this chart suggests that this time is different. Considering that we’ve never seen this signal until now, the implication is that the 1-year trend might stay below the 3-year trend even longer! Interestingly, we’re getting very close to seeing the 2-year trend (teal) cross below the 3-year trend, which would also be a first. Personally, I wouldn’t be surprised if that occurs within the next 6 months as a result of further sideways action or downward consolidation.
Best,
Caleb Franzen
DISCLAIMER:
This report expresses the views of the author as of the date it was published, and are subjected to change without notice. The investment thesis, security analysis, risk appetite, and time frames expressed above are strictly those of the author and are not intended to be interpreted as financial advice. As such, market views covered in this publication are not to be considered investment advice and should be regarded as information only. Everyone is responsible to conduct their own due diligence, understand the risks associated with any information that is reviewed, and to recognize that the information contained herein does not constitute and should be construed as a solicitation of advisory services. Cubic Analytics believes that the information & sources from which information is being taken are accurate, but cannot guarantee the accuracy of such information.
This report may not be copied, reproduced, republished or posted without the consent of Cubic Analytics and/or Caleb Franzen, without proper citation & reference.
As always, consult a registered financial advisor and/or certified financial planner before making any investment decisions.


Congrats on passing 4,000 subscribers!