

A New Bullish Signal For Bitcoin

Investors,
In November 2022, I shared the following Bitcoin analysis on Twitter:
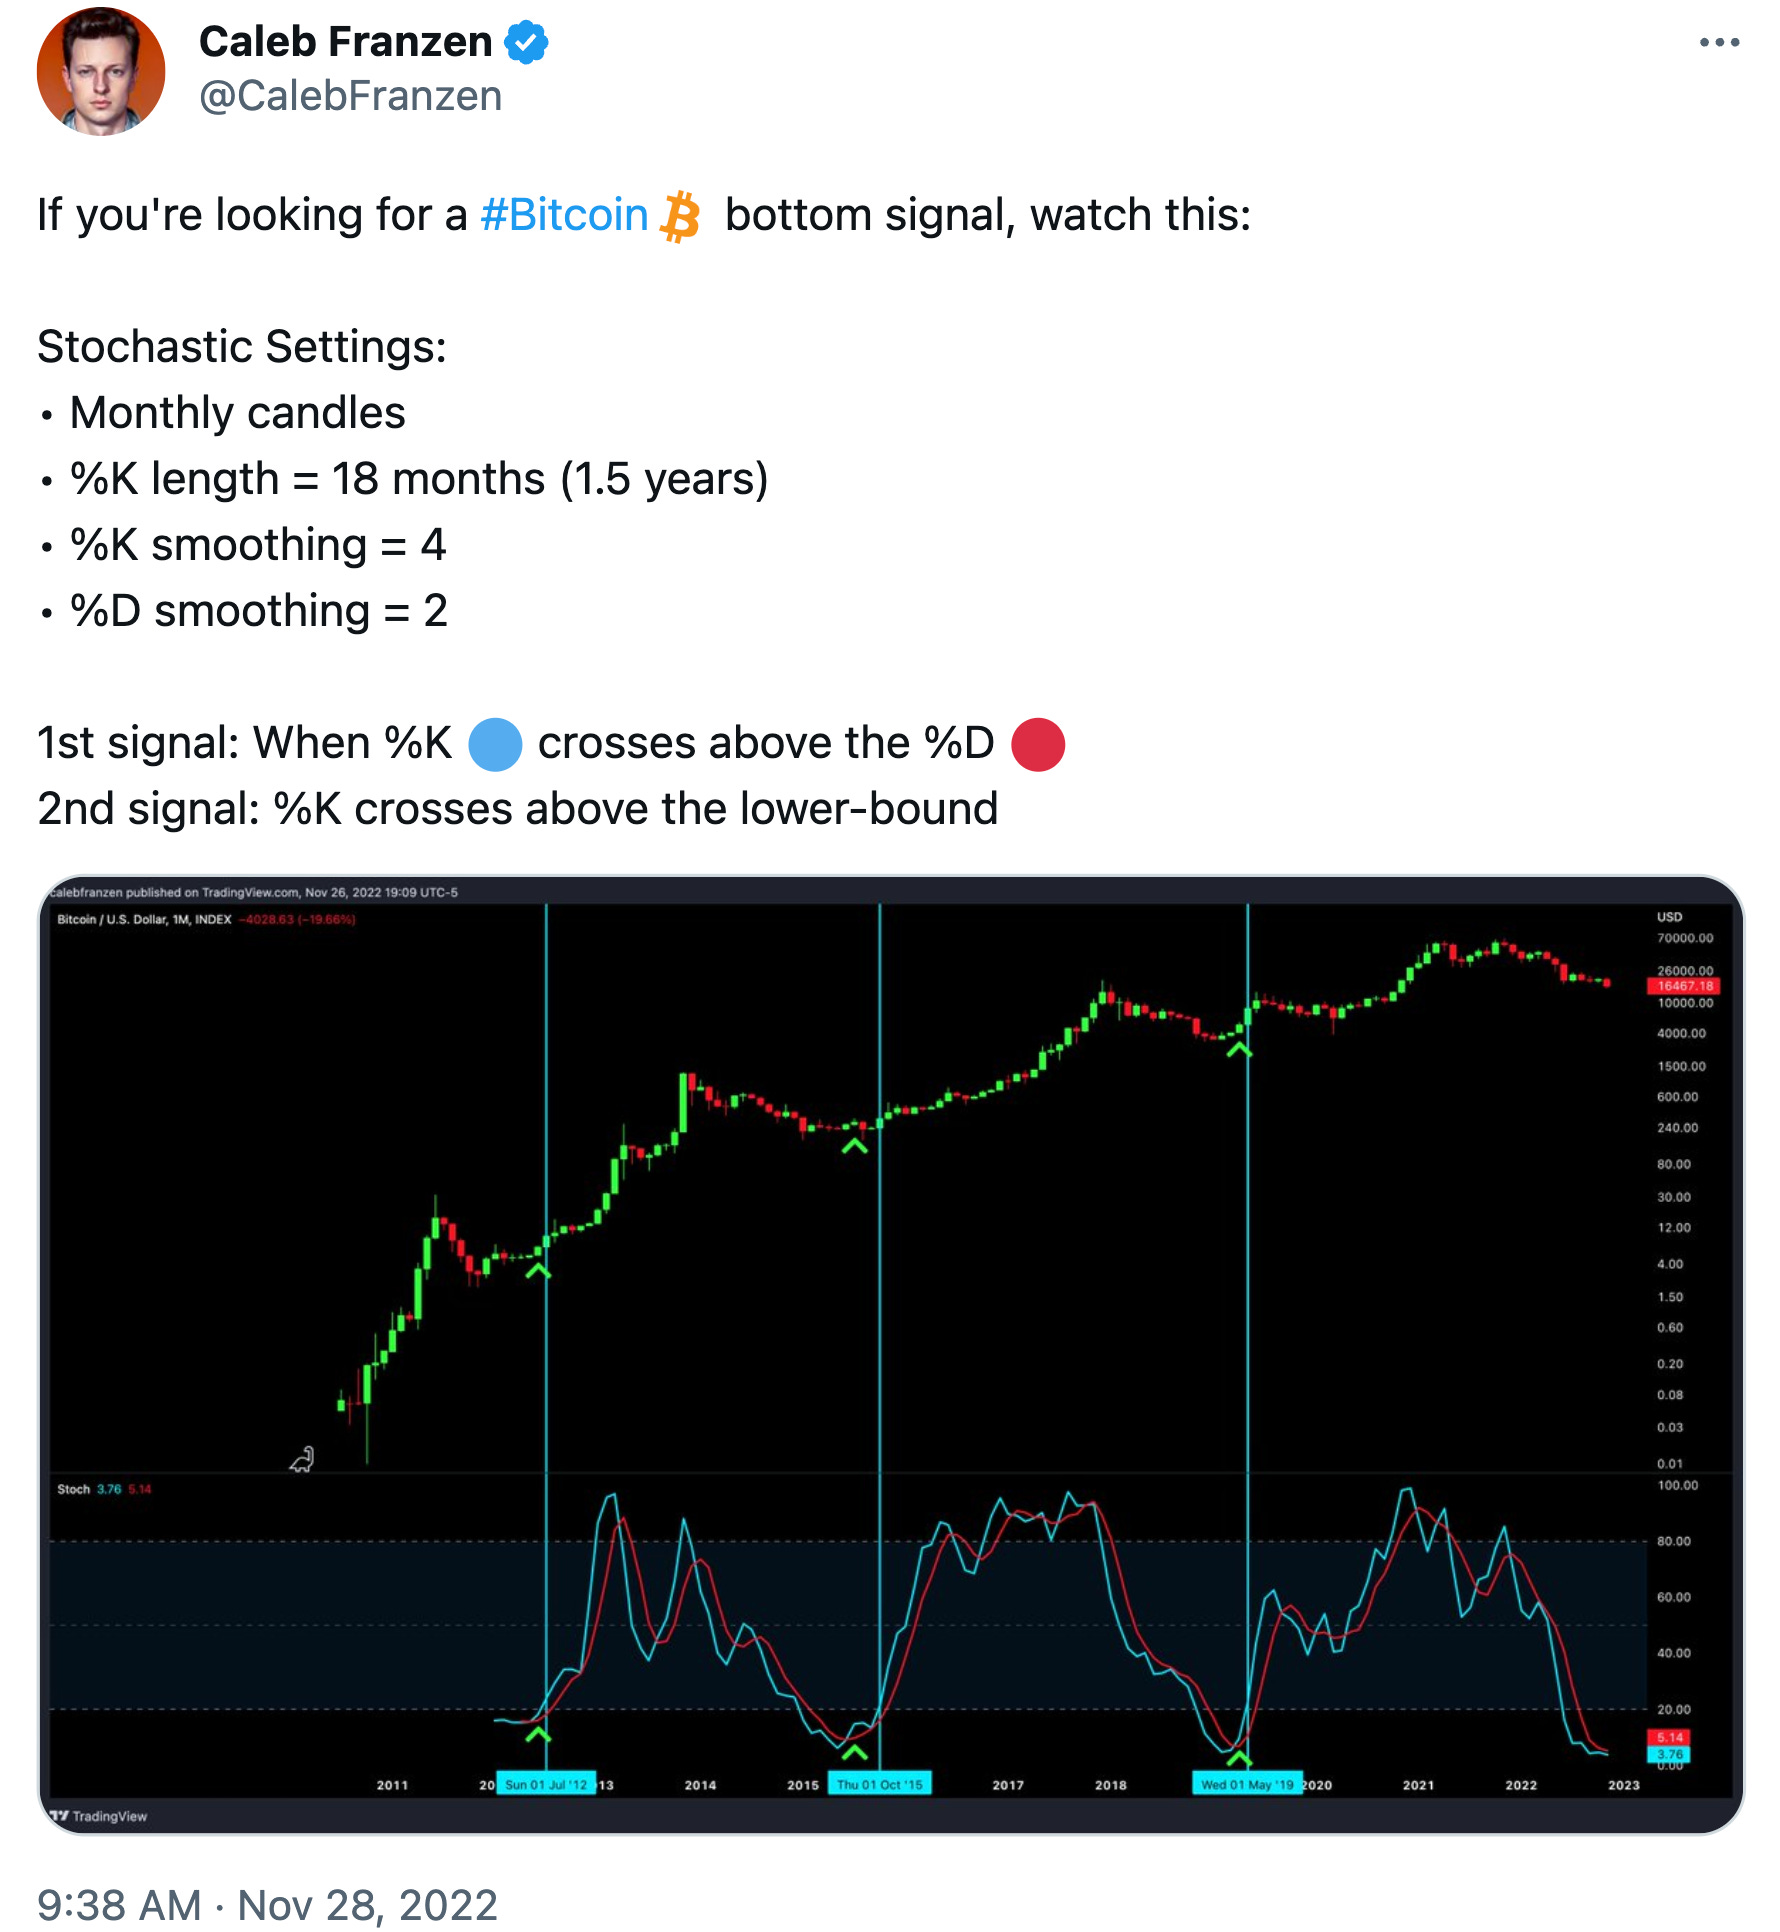
As we look at the current Bitcoin chart with the same stochastic analysis, we can see that both bullish signals have flashed! More specifically, the first signal flashed in the month of January and the second one flashed in April, set to be confirmed for the May close in a few days.
We continue to see strong statistical relationships flash bullish signals across the board, ranging from:
Price > the 200-day moving average cloud
Price > the 200-day moving average cloud
The 12-month Williams%R oscillator ≠ oversold
The 18-month Williams%R oscillator ≠ oversold
Price > the short-term holder realized price
Price > the long-term holder realized price
Short-term holder realized price > long-term holder realized price
18-month Stochastic crossover
For each of these specific indicators, I outlined the bullish signals before they occurred & told investors what to look for. Did I know that they’d occur this quickly? No. But I did know that they were extremely important signals and I did my best to highlight them in advance. While statistics and on-chain data don’t operate in vacuum absent of macroeconomic factors and monetary policy, I think investors have plenty of ammo to defend a bullish bias. I do.
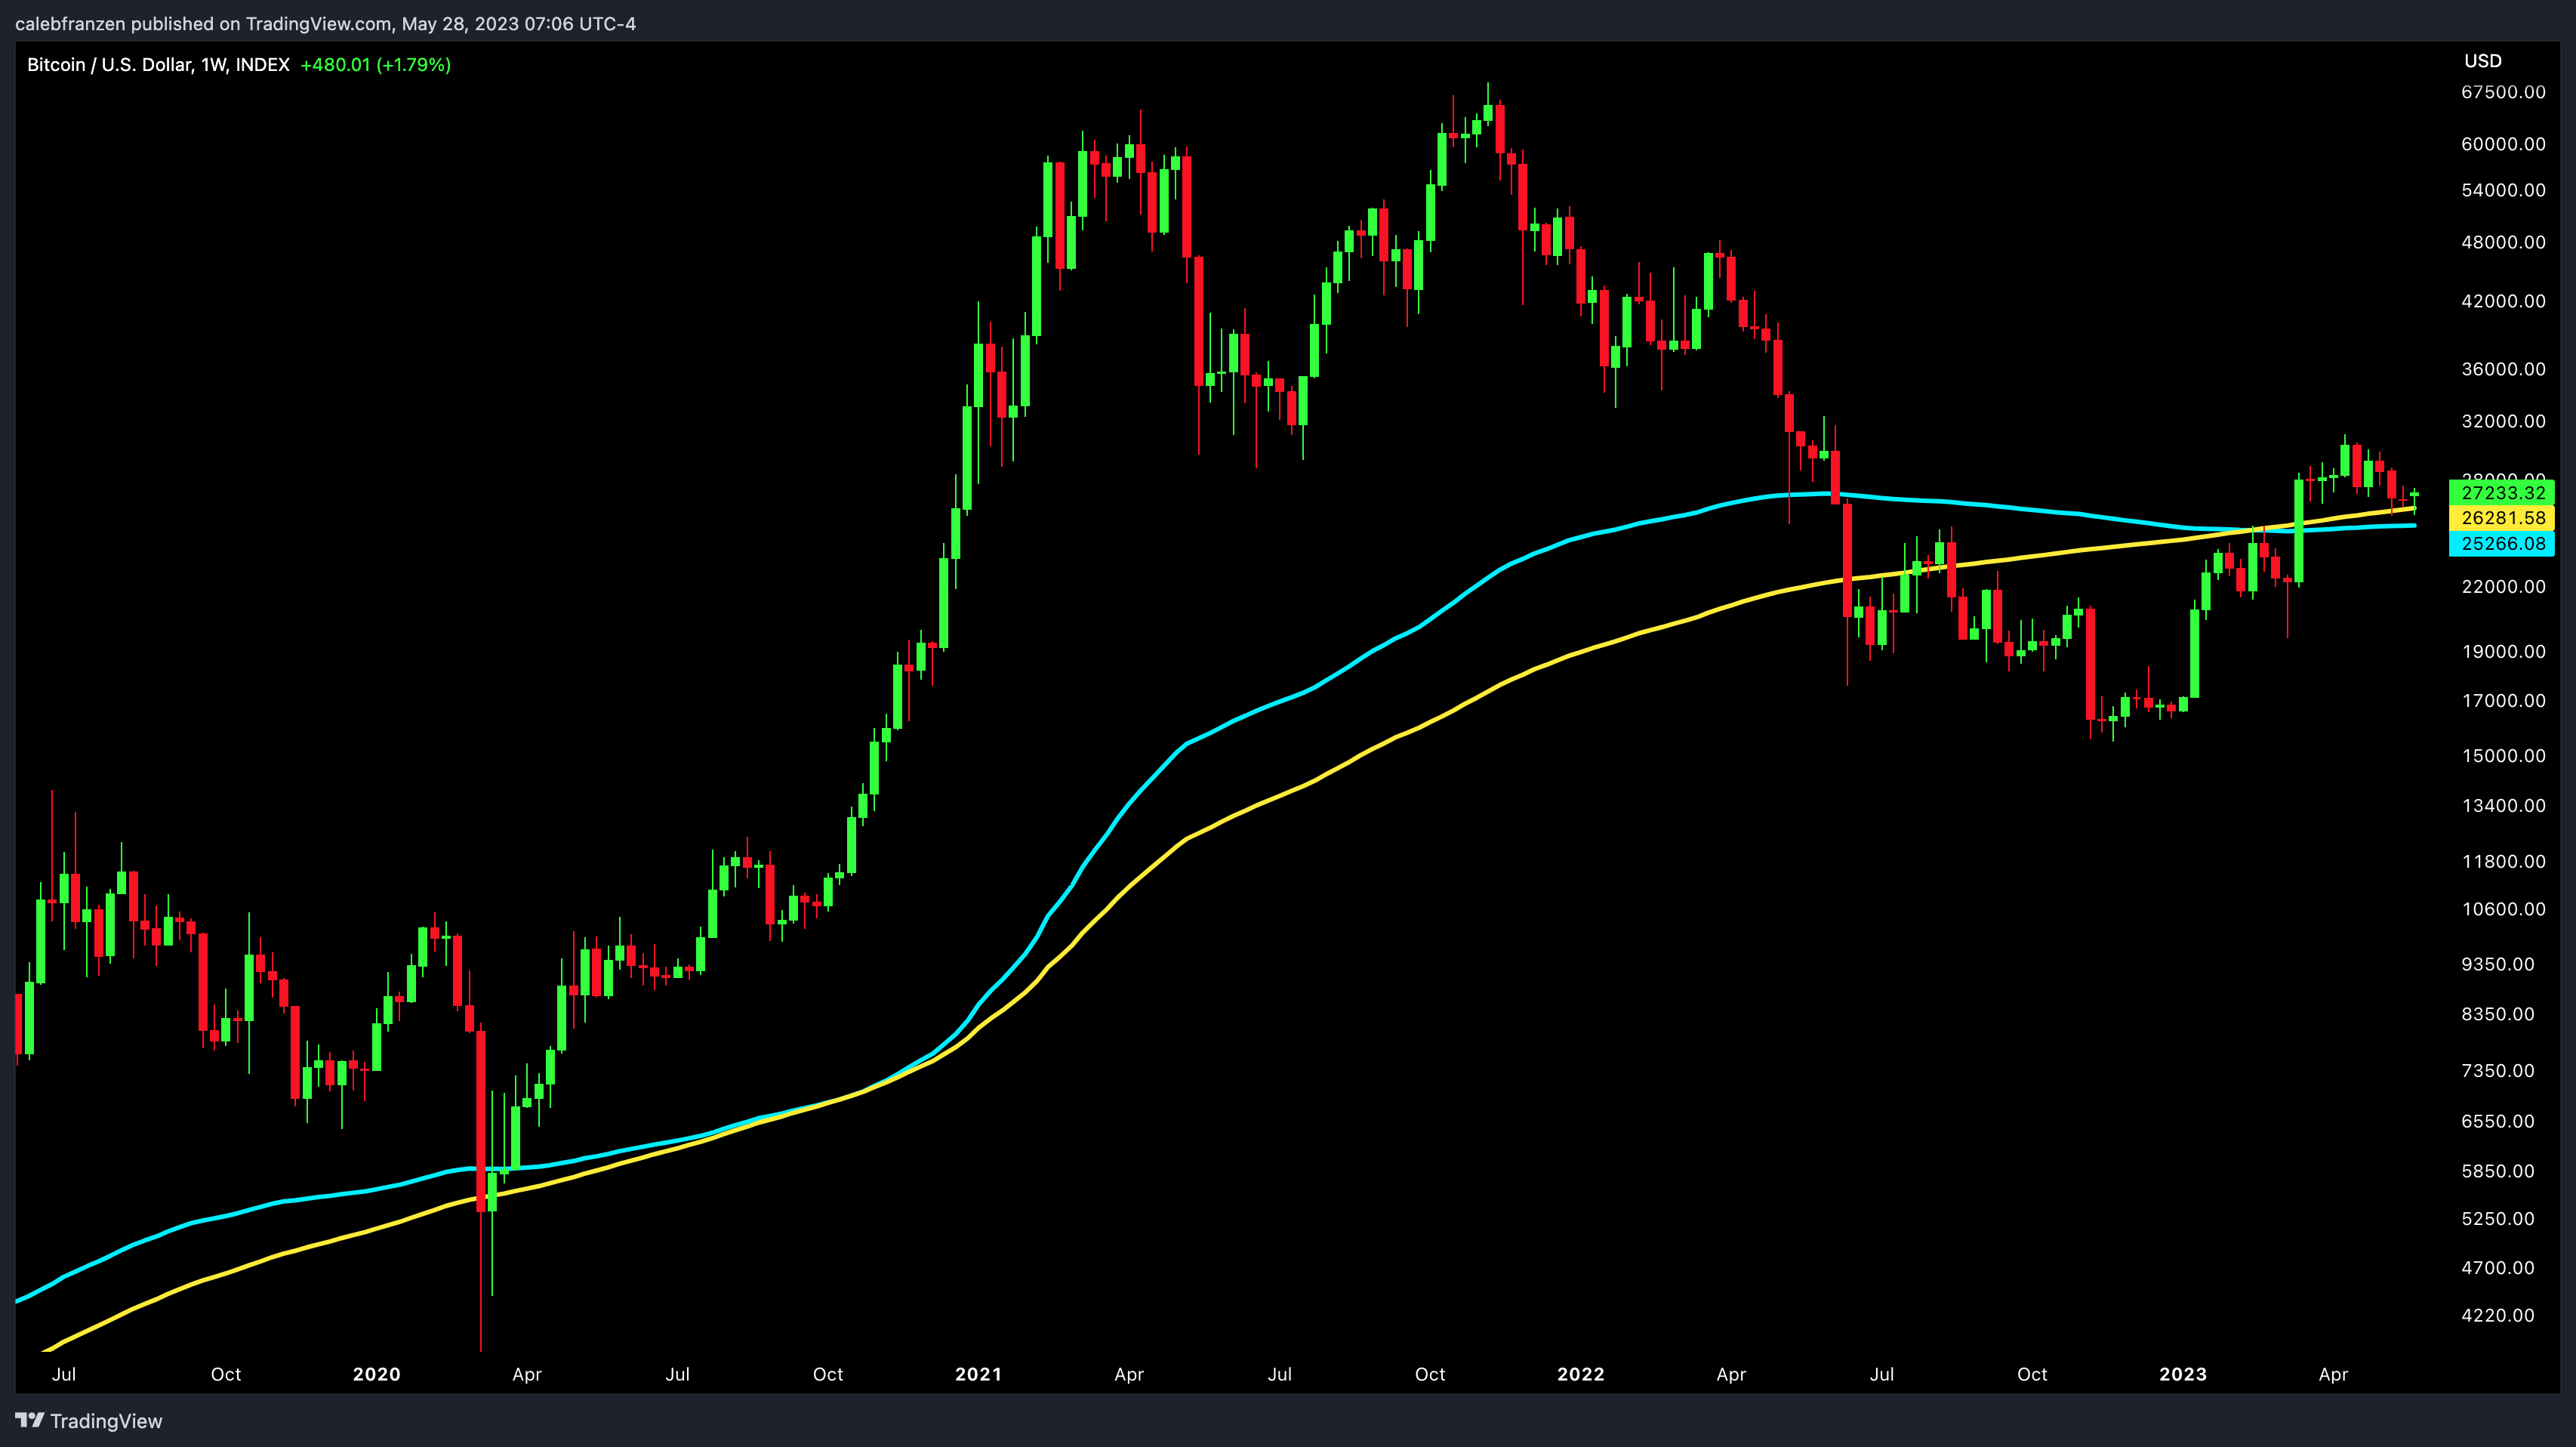
In fact, the latest retest of the 200-week moving average as potential support is working nicely and actually strengthens the bullish argument!
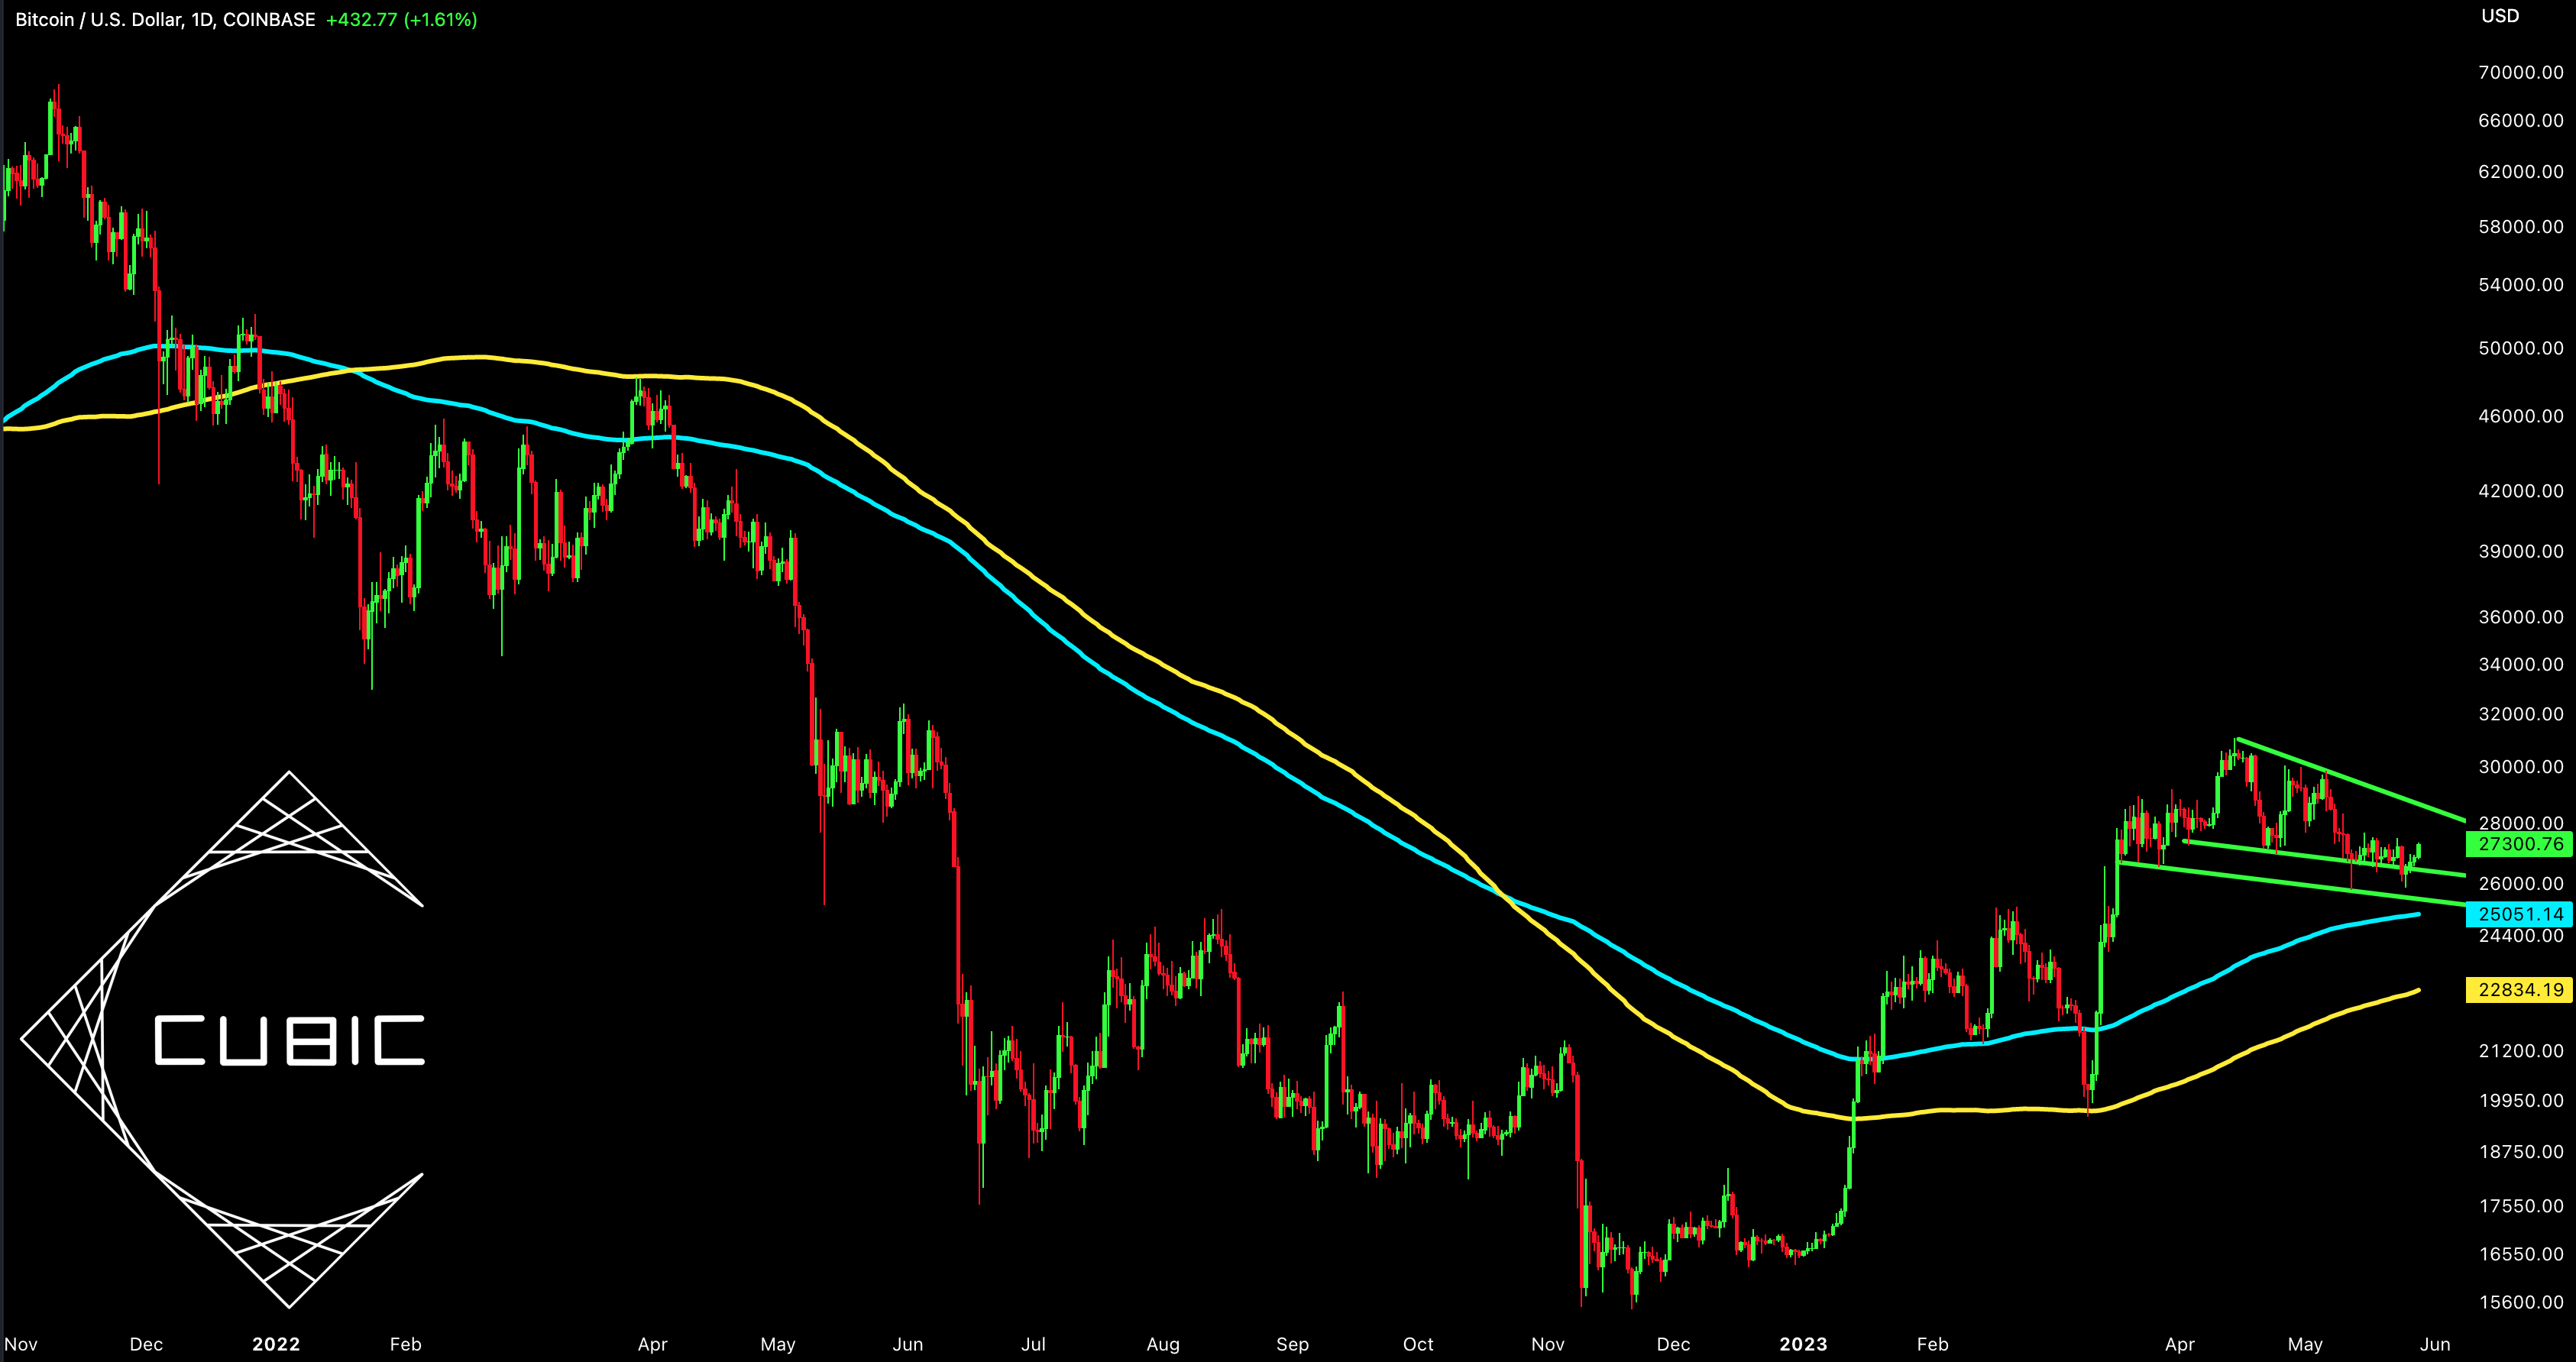
Even on a short-term basis, I’d like to see Bitcoin breakout from this wedge before getting more confidence that we’re entering the next stage of an uptrend.
In the remainder of this exclusive premium report, I’ll cover the following topics:
More Bitcoin indicators & crypto market signals
S&P 500 market internals & under-the-hood metrics
3 miscellaneous charts you should have on your radar
The inverse correlation between the U.S. dollar & risk assets is breaking
On the aggregate, this report will analyze 14 of the top charts that I think you need to have on your radar as an investor. To access these premium reports, in addition to the free weekly publications from Cubic Analytics, consider upgrading your membership today.