
6 Charts in 180 Seconds

Investors,
This is the National Financial Conditions Index, from the Chicago Fed:
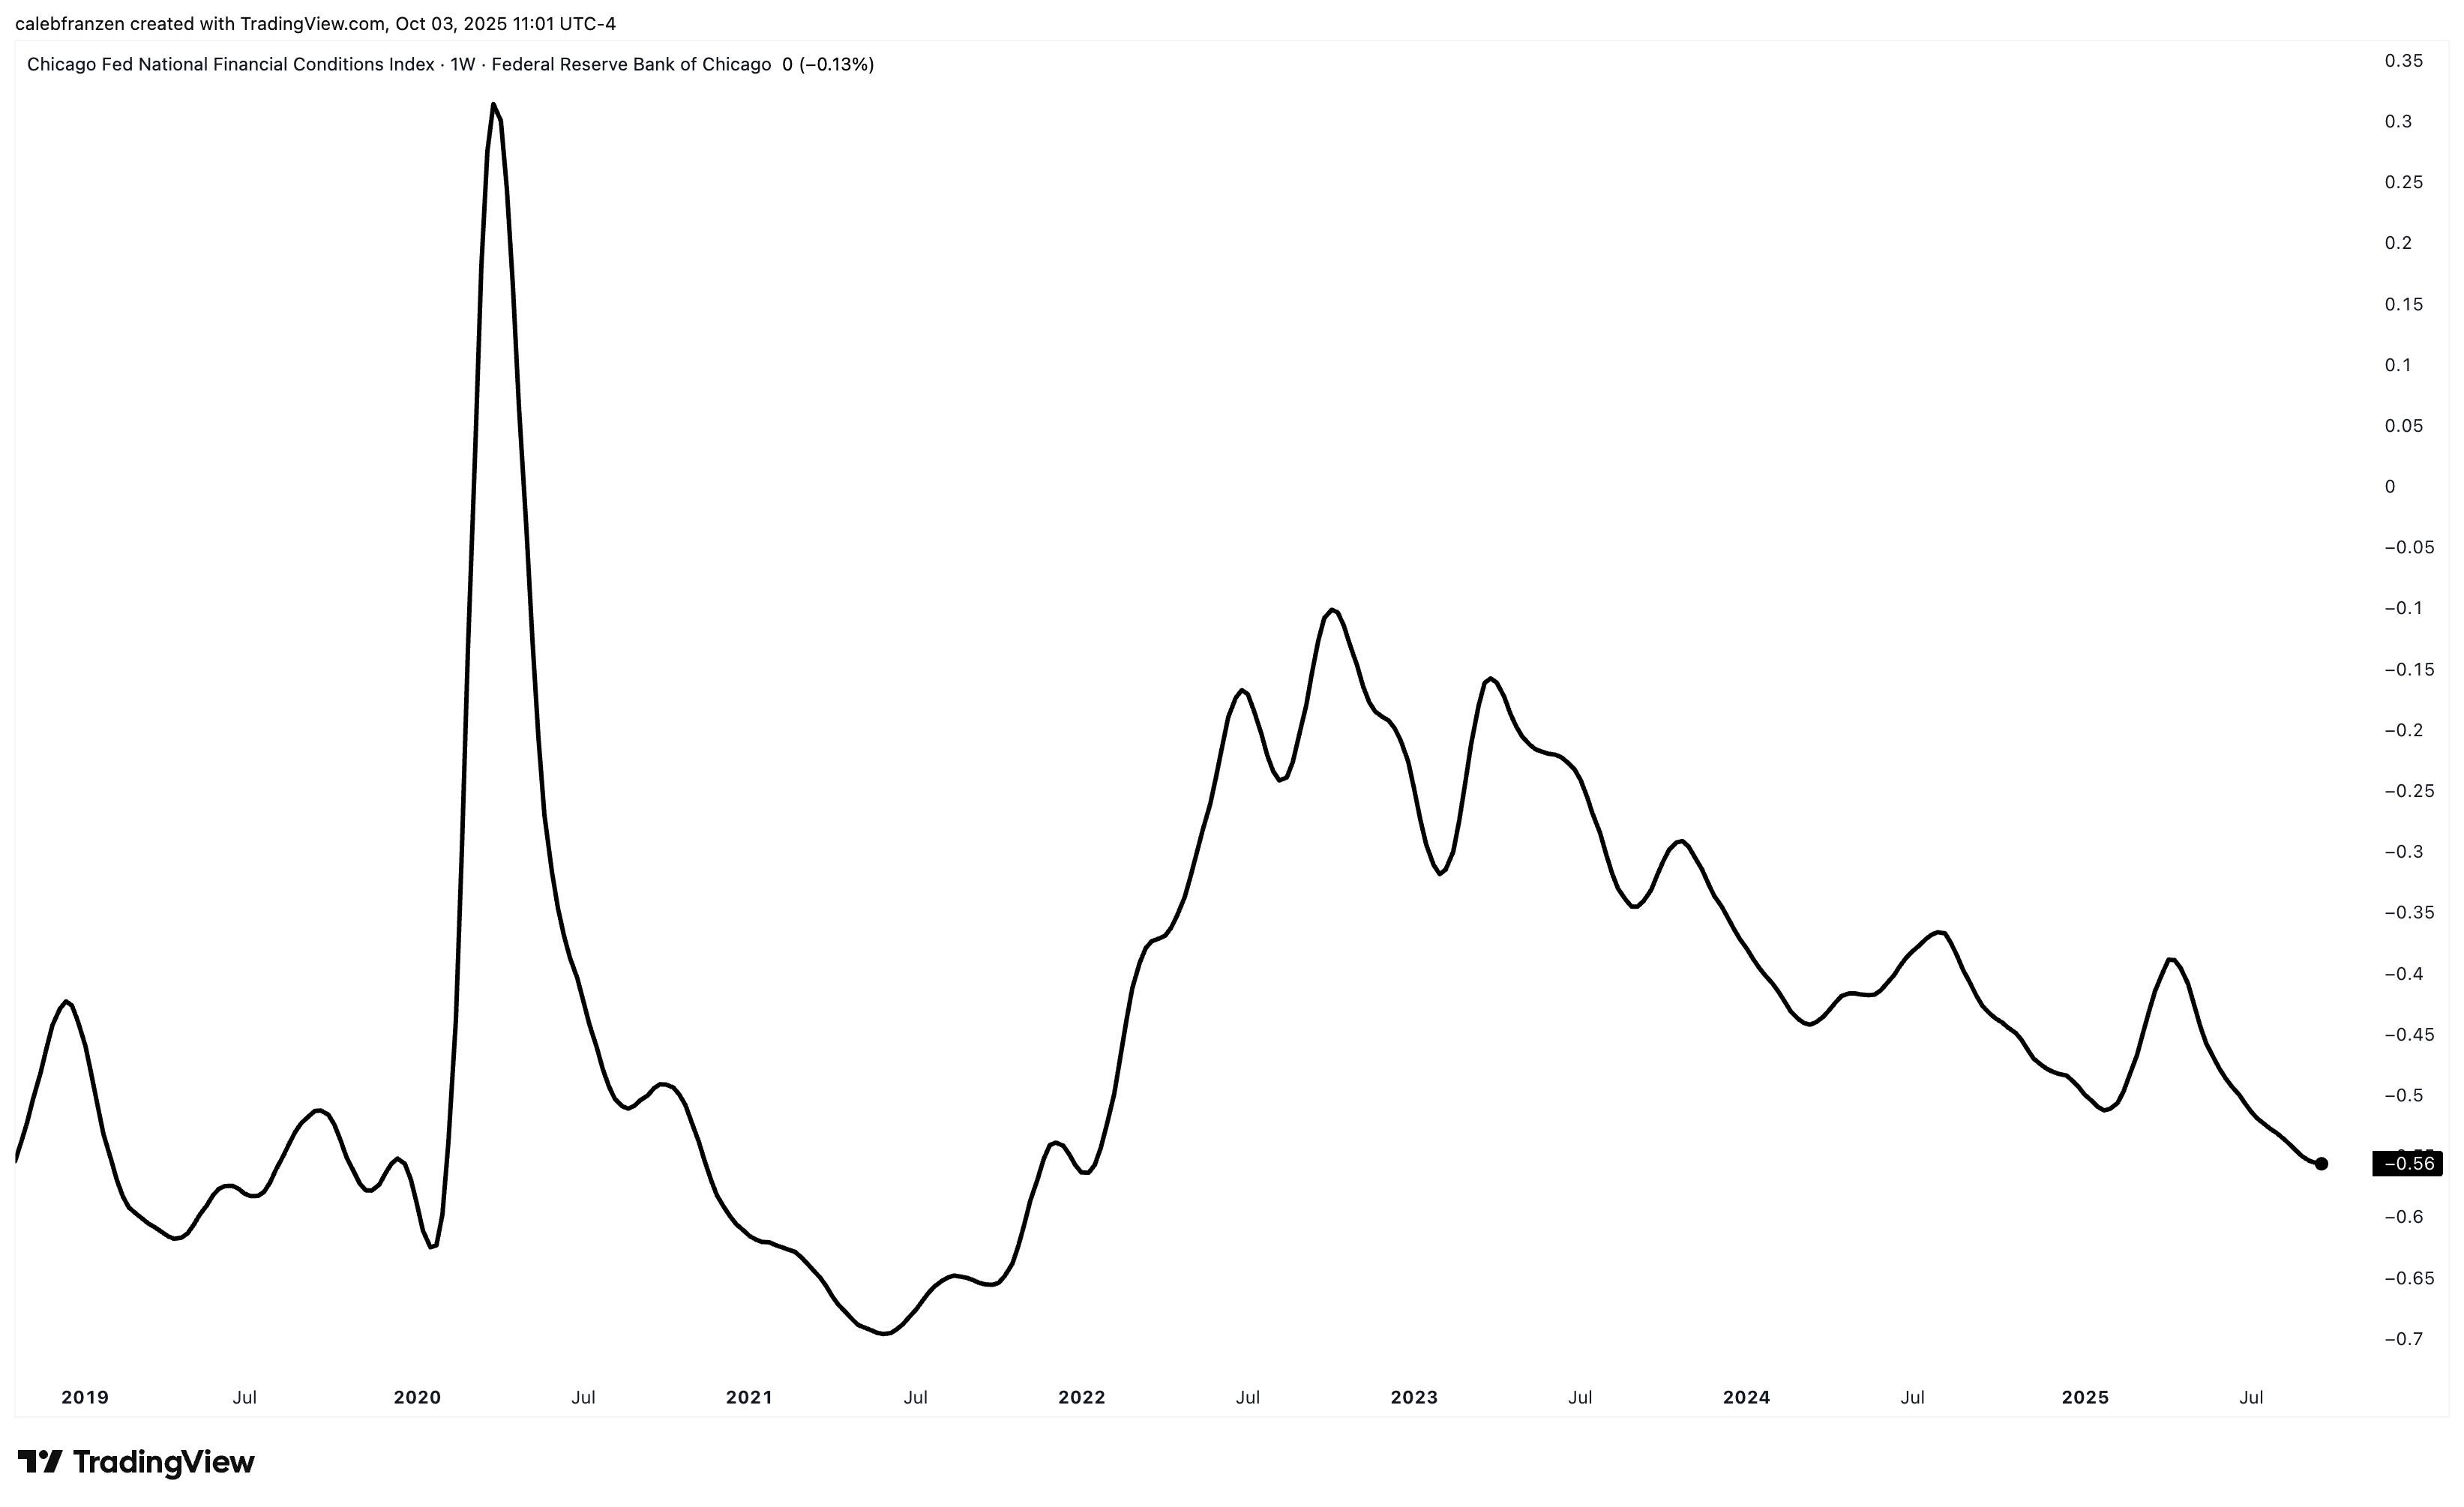
The downward trajectory reflects looser (or easy) financial conditions.
As you might expect, this bodes well for asset prices…
If we invert the NFCI, we can see a clear correlation with the Russell 2000:
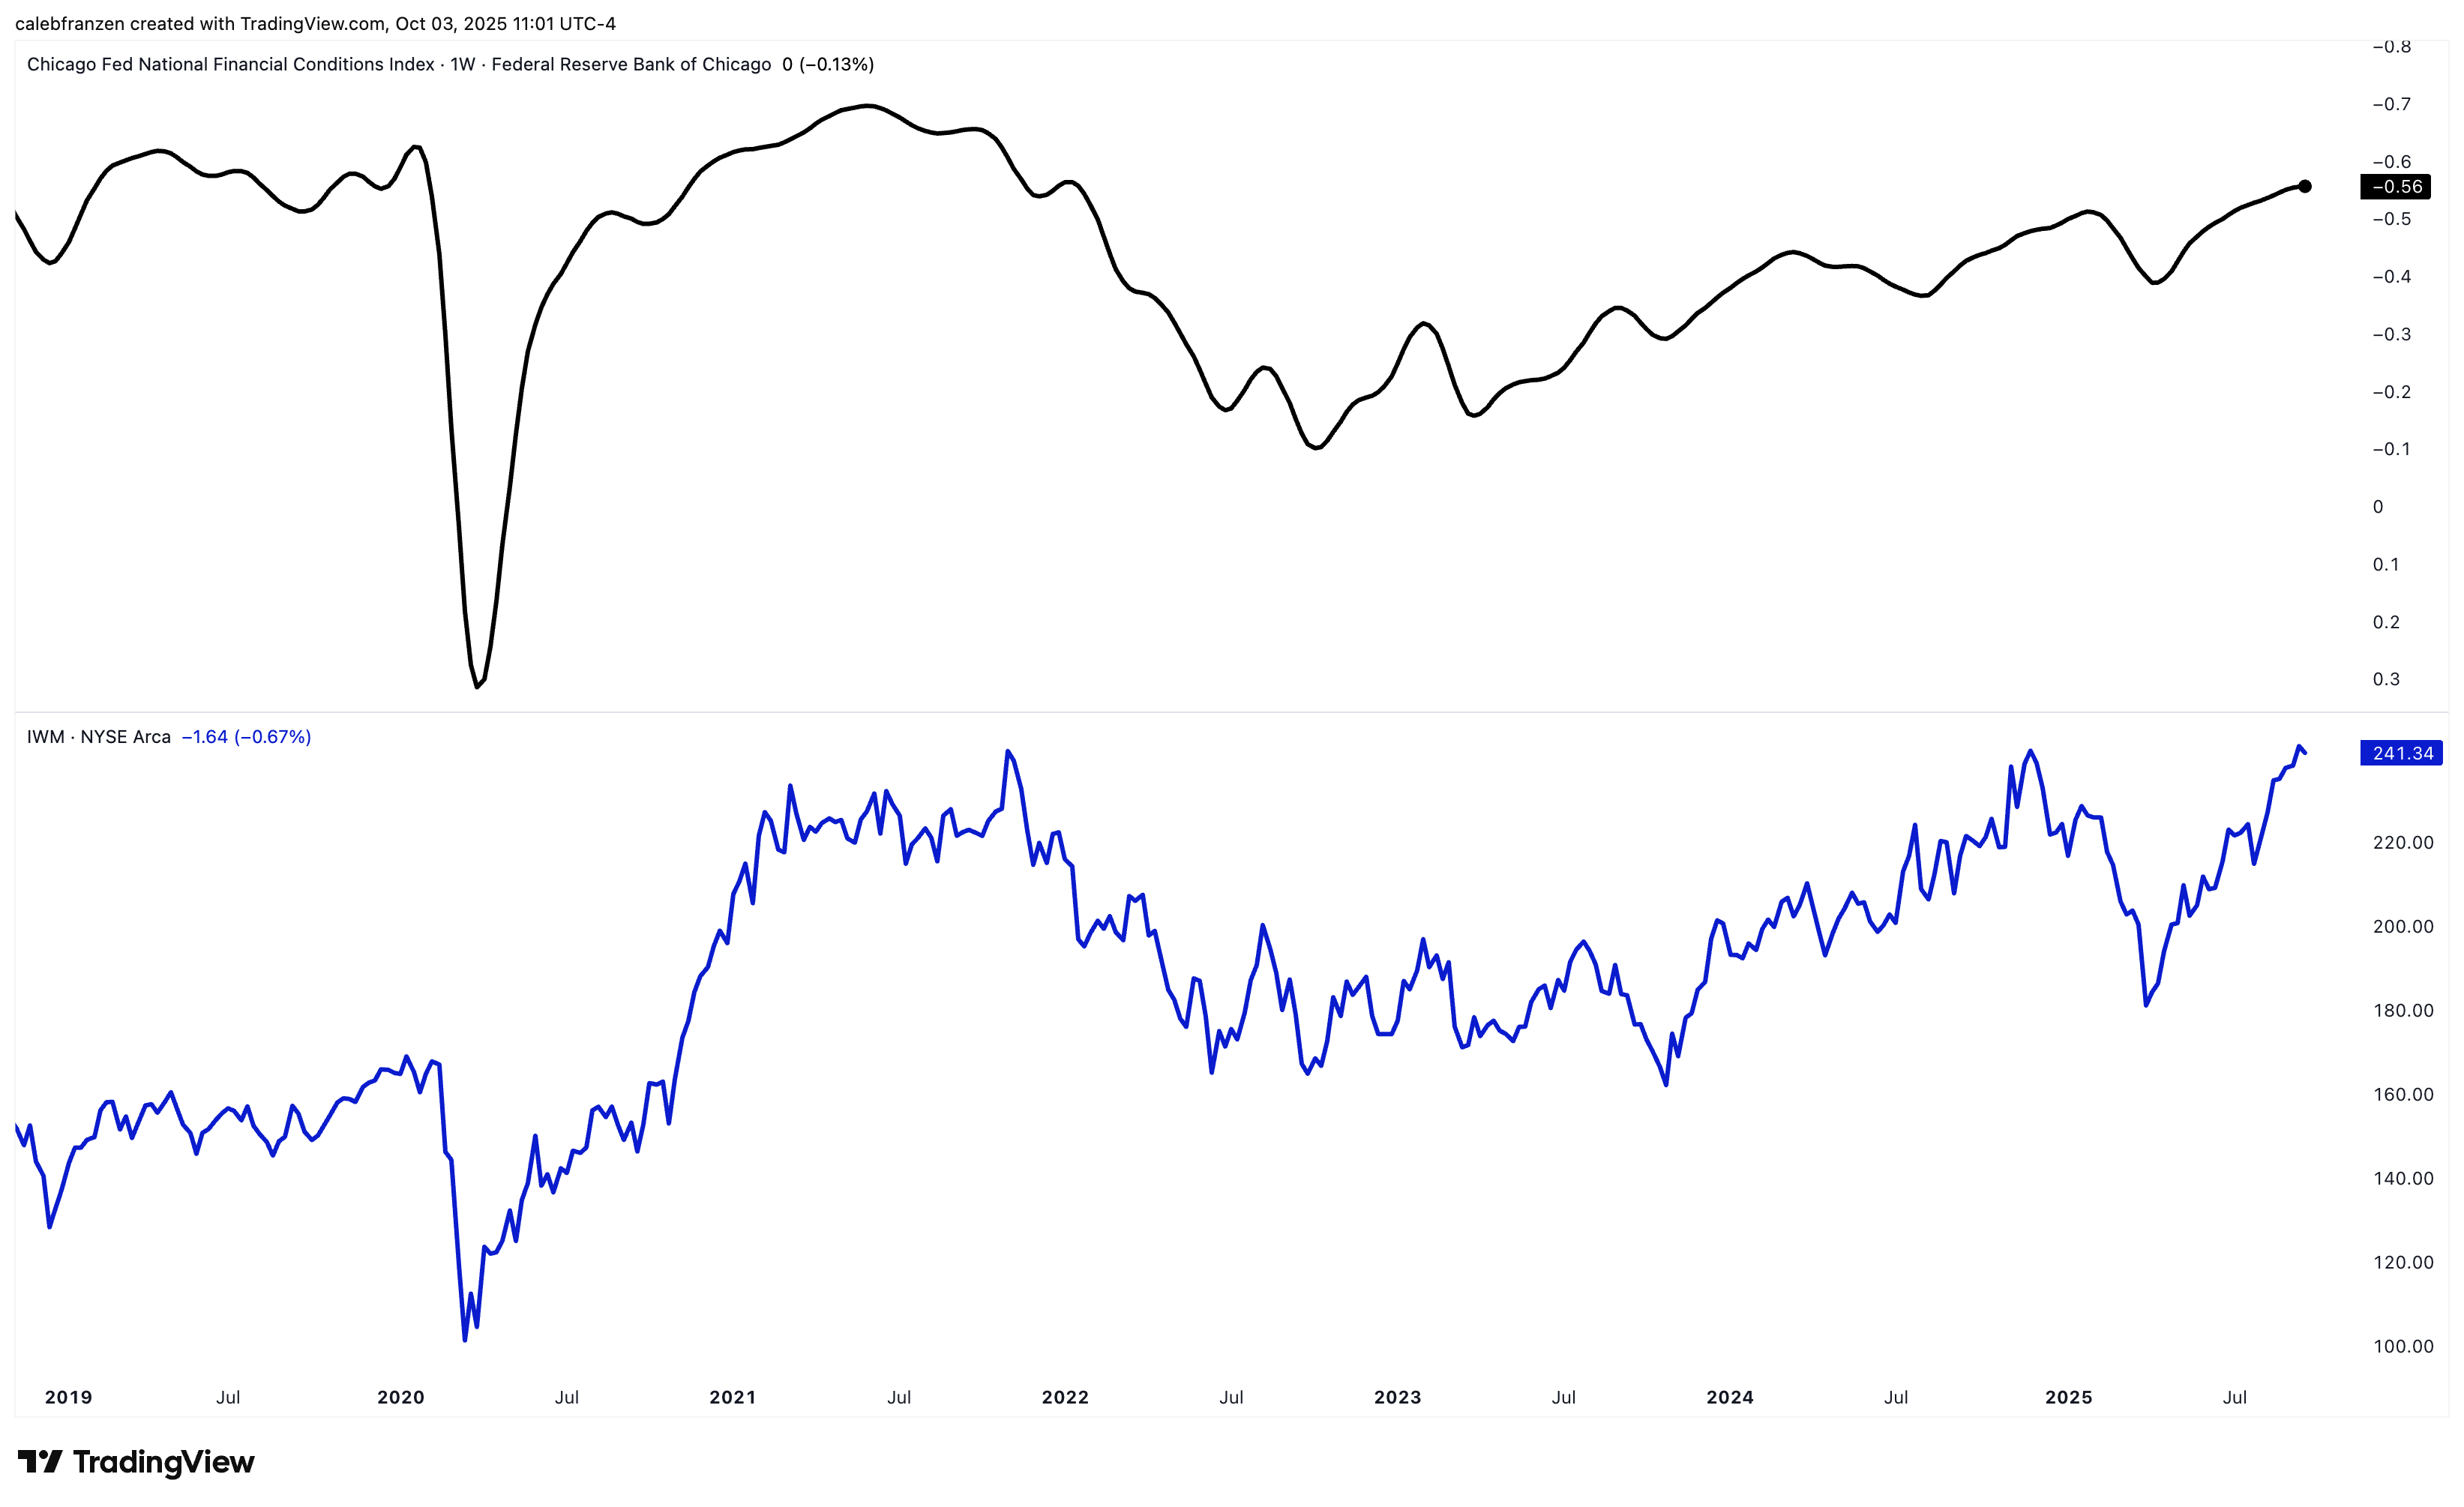
Not necessarily in terms of magnitude, but the directional correlation is obvious.
With stocks continuing to make new all-time highs, across a wide range of sectors, industries, and investment themes, we’re seeing strong confirmation of this bull market.
Just look at industrial stocks ($XLI), which briefly made new ATHs on Friday:
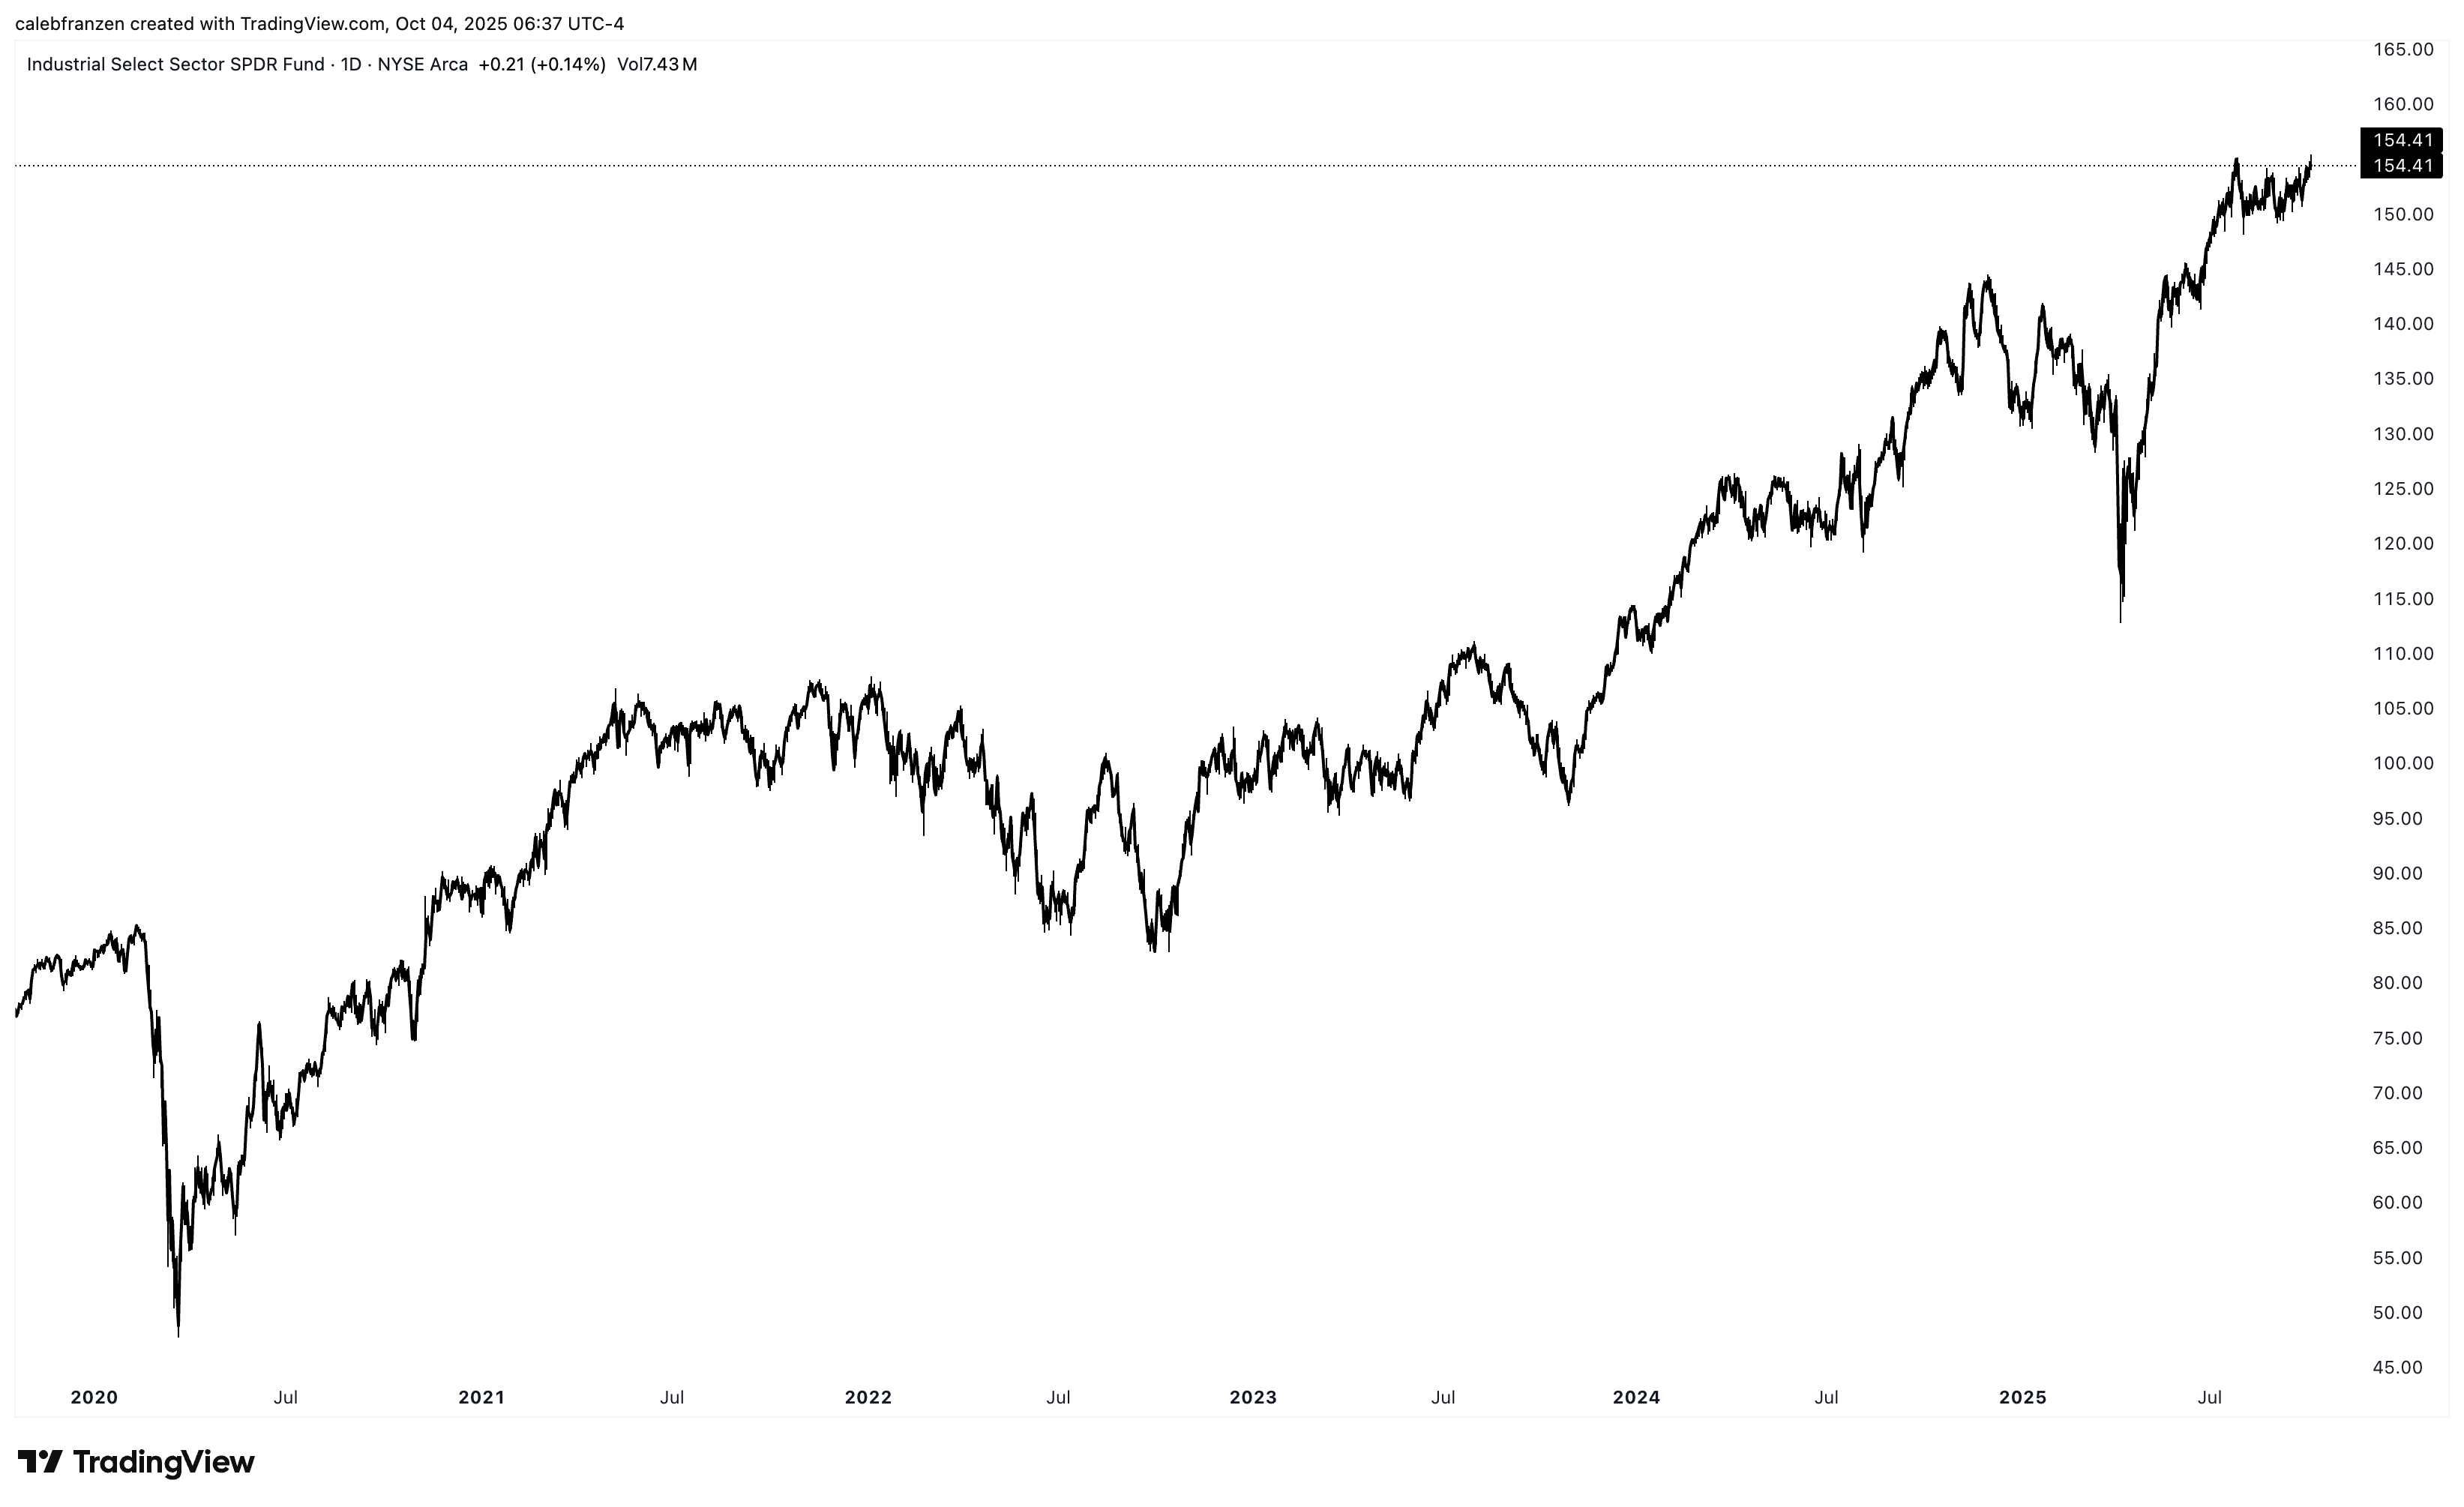
Why is this so important?
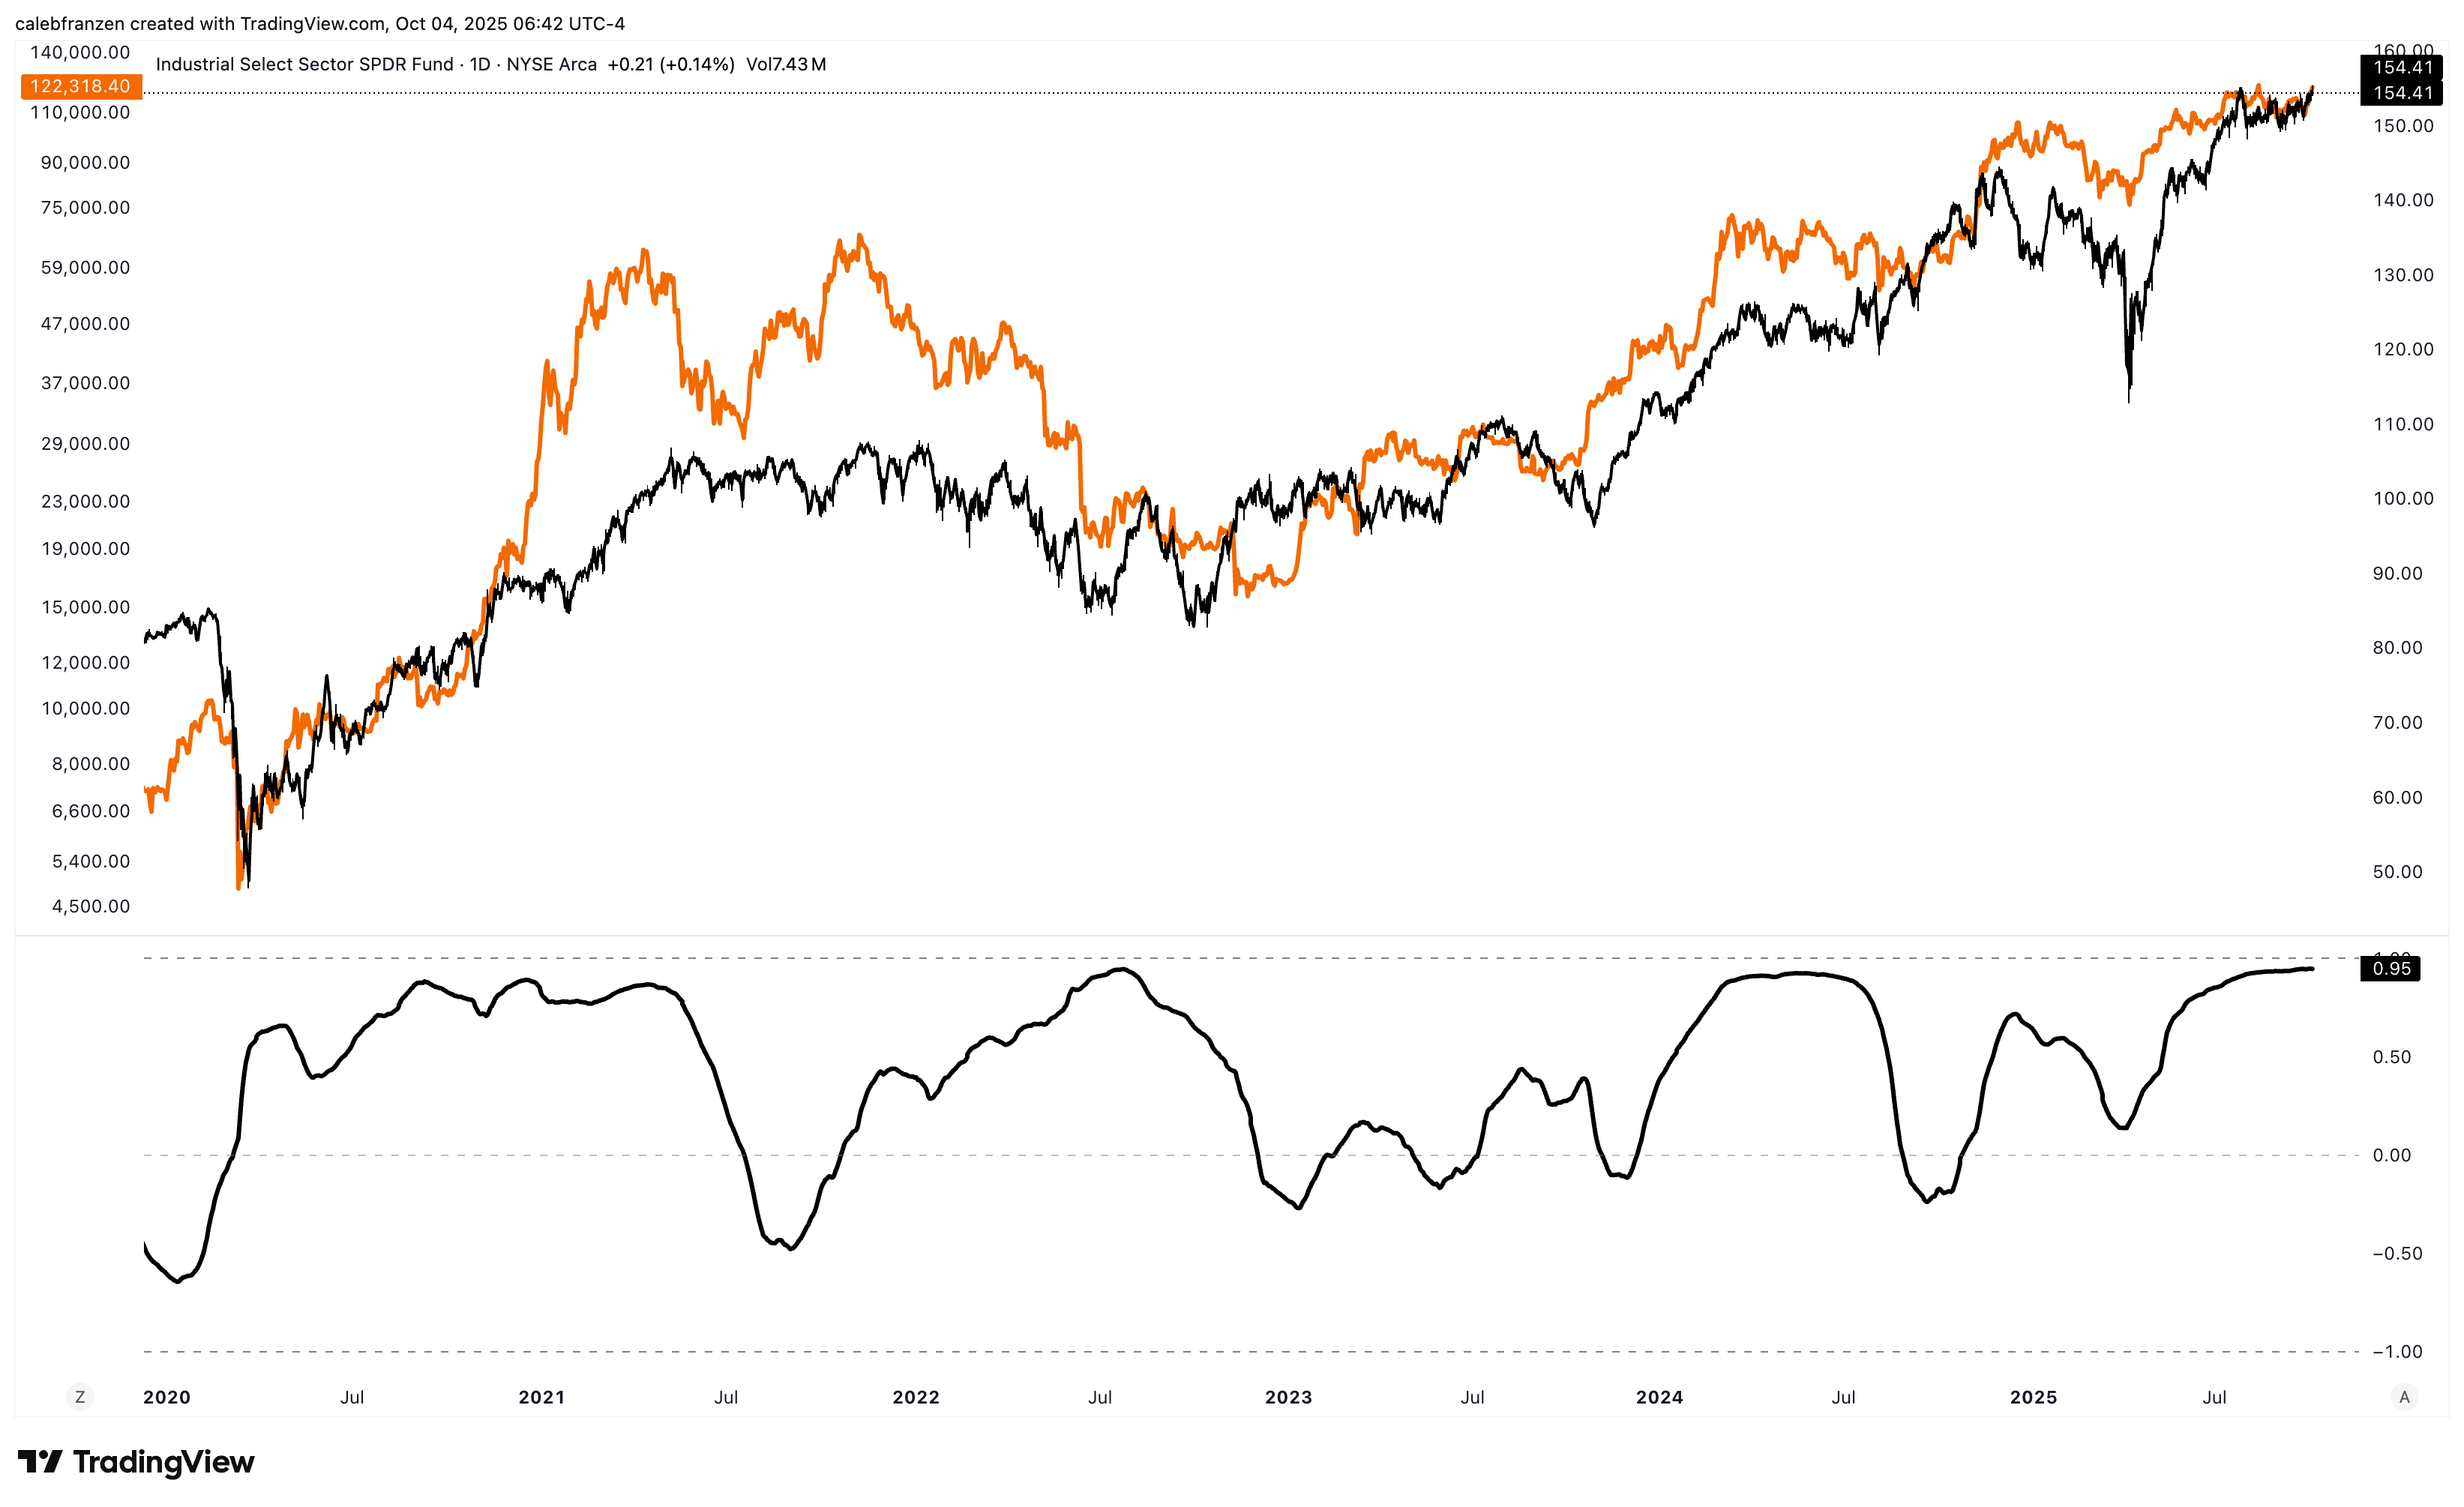
Maybe you’re a Bitcoin/crypto investor and have zero interest in what industrials do.
You should care, and here’s why…
Bitcoin has a 95% trailing 6M correlation to industrials:
As we look at the weight of the evidence, investors are displaying their confidence in the future by bidding risk assets to new all-time highs, confirming the nature of the ongoing uptrend.
What is making them so optimistic and confident about the future?
I don’t know and I genuinely don’t care…
All I care about is the fact that they’re putting their money where their mouth is.
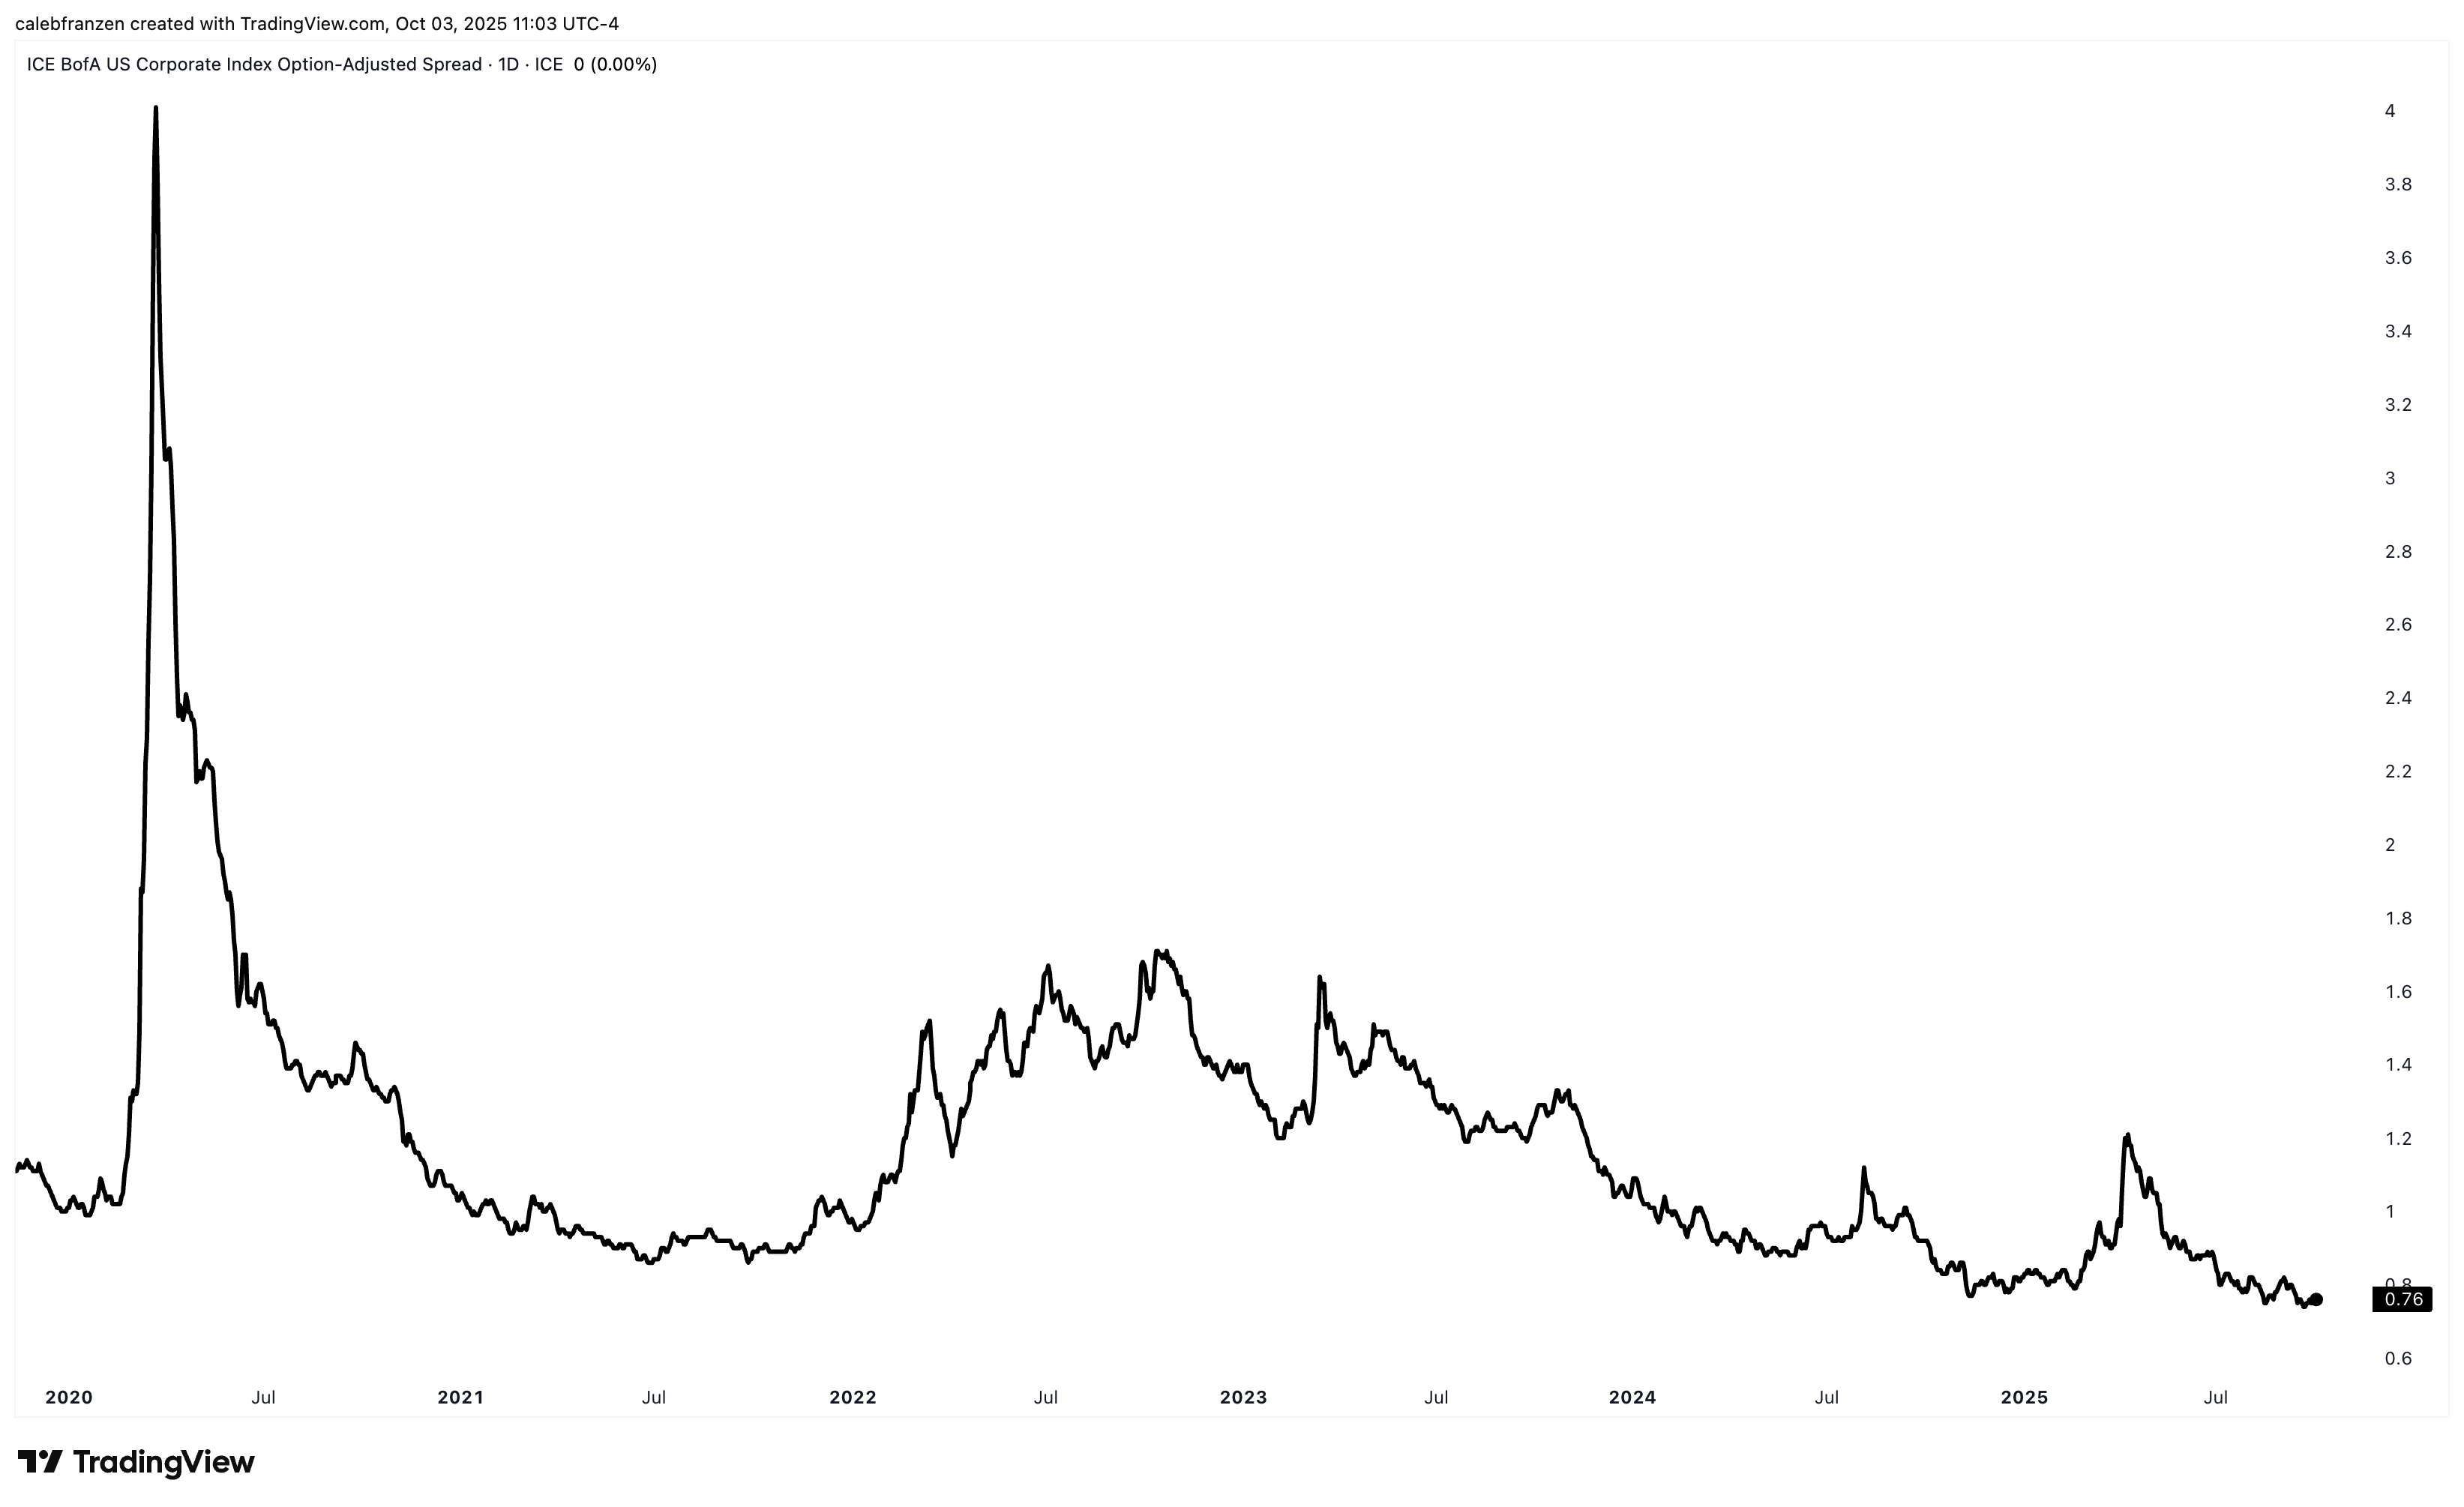
Now take a look at credit markets… corporate spreads in the U.S. are making new lows.
Similar to my analysis on the NFCI, we can invert this chart and overlay the S&P 500:
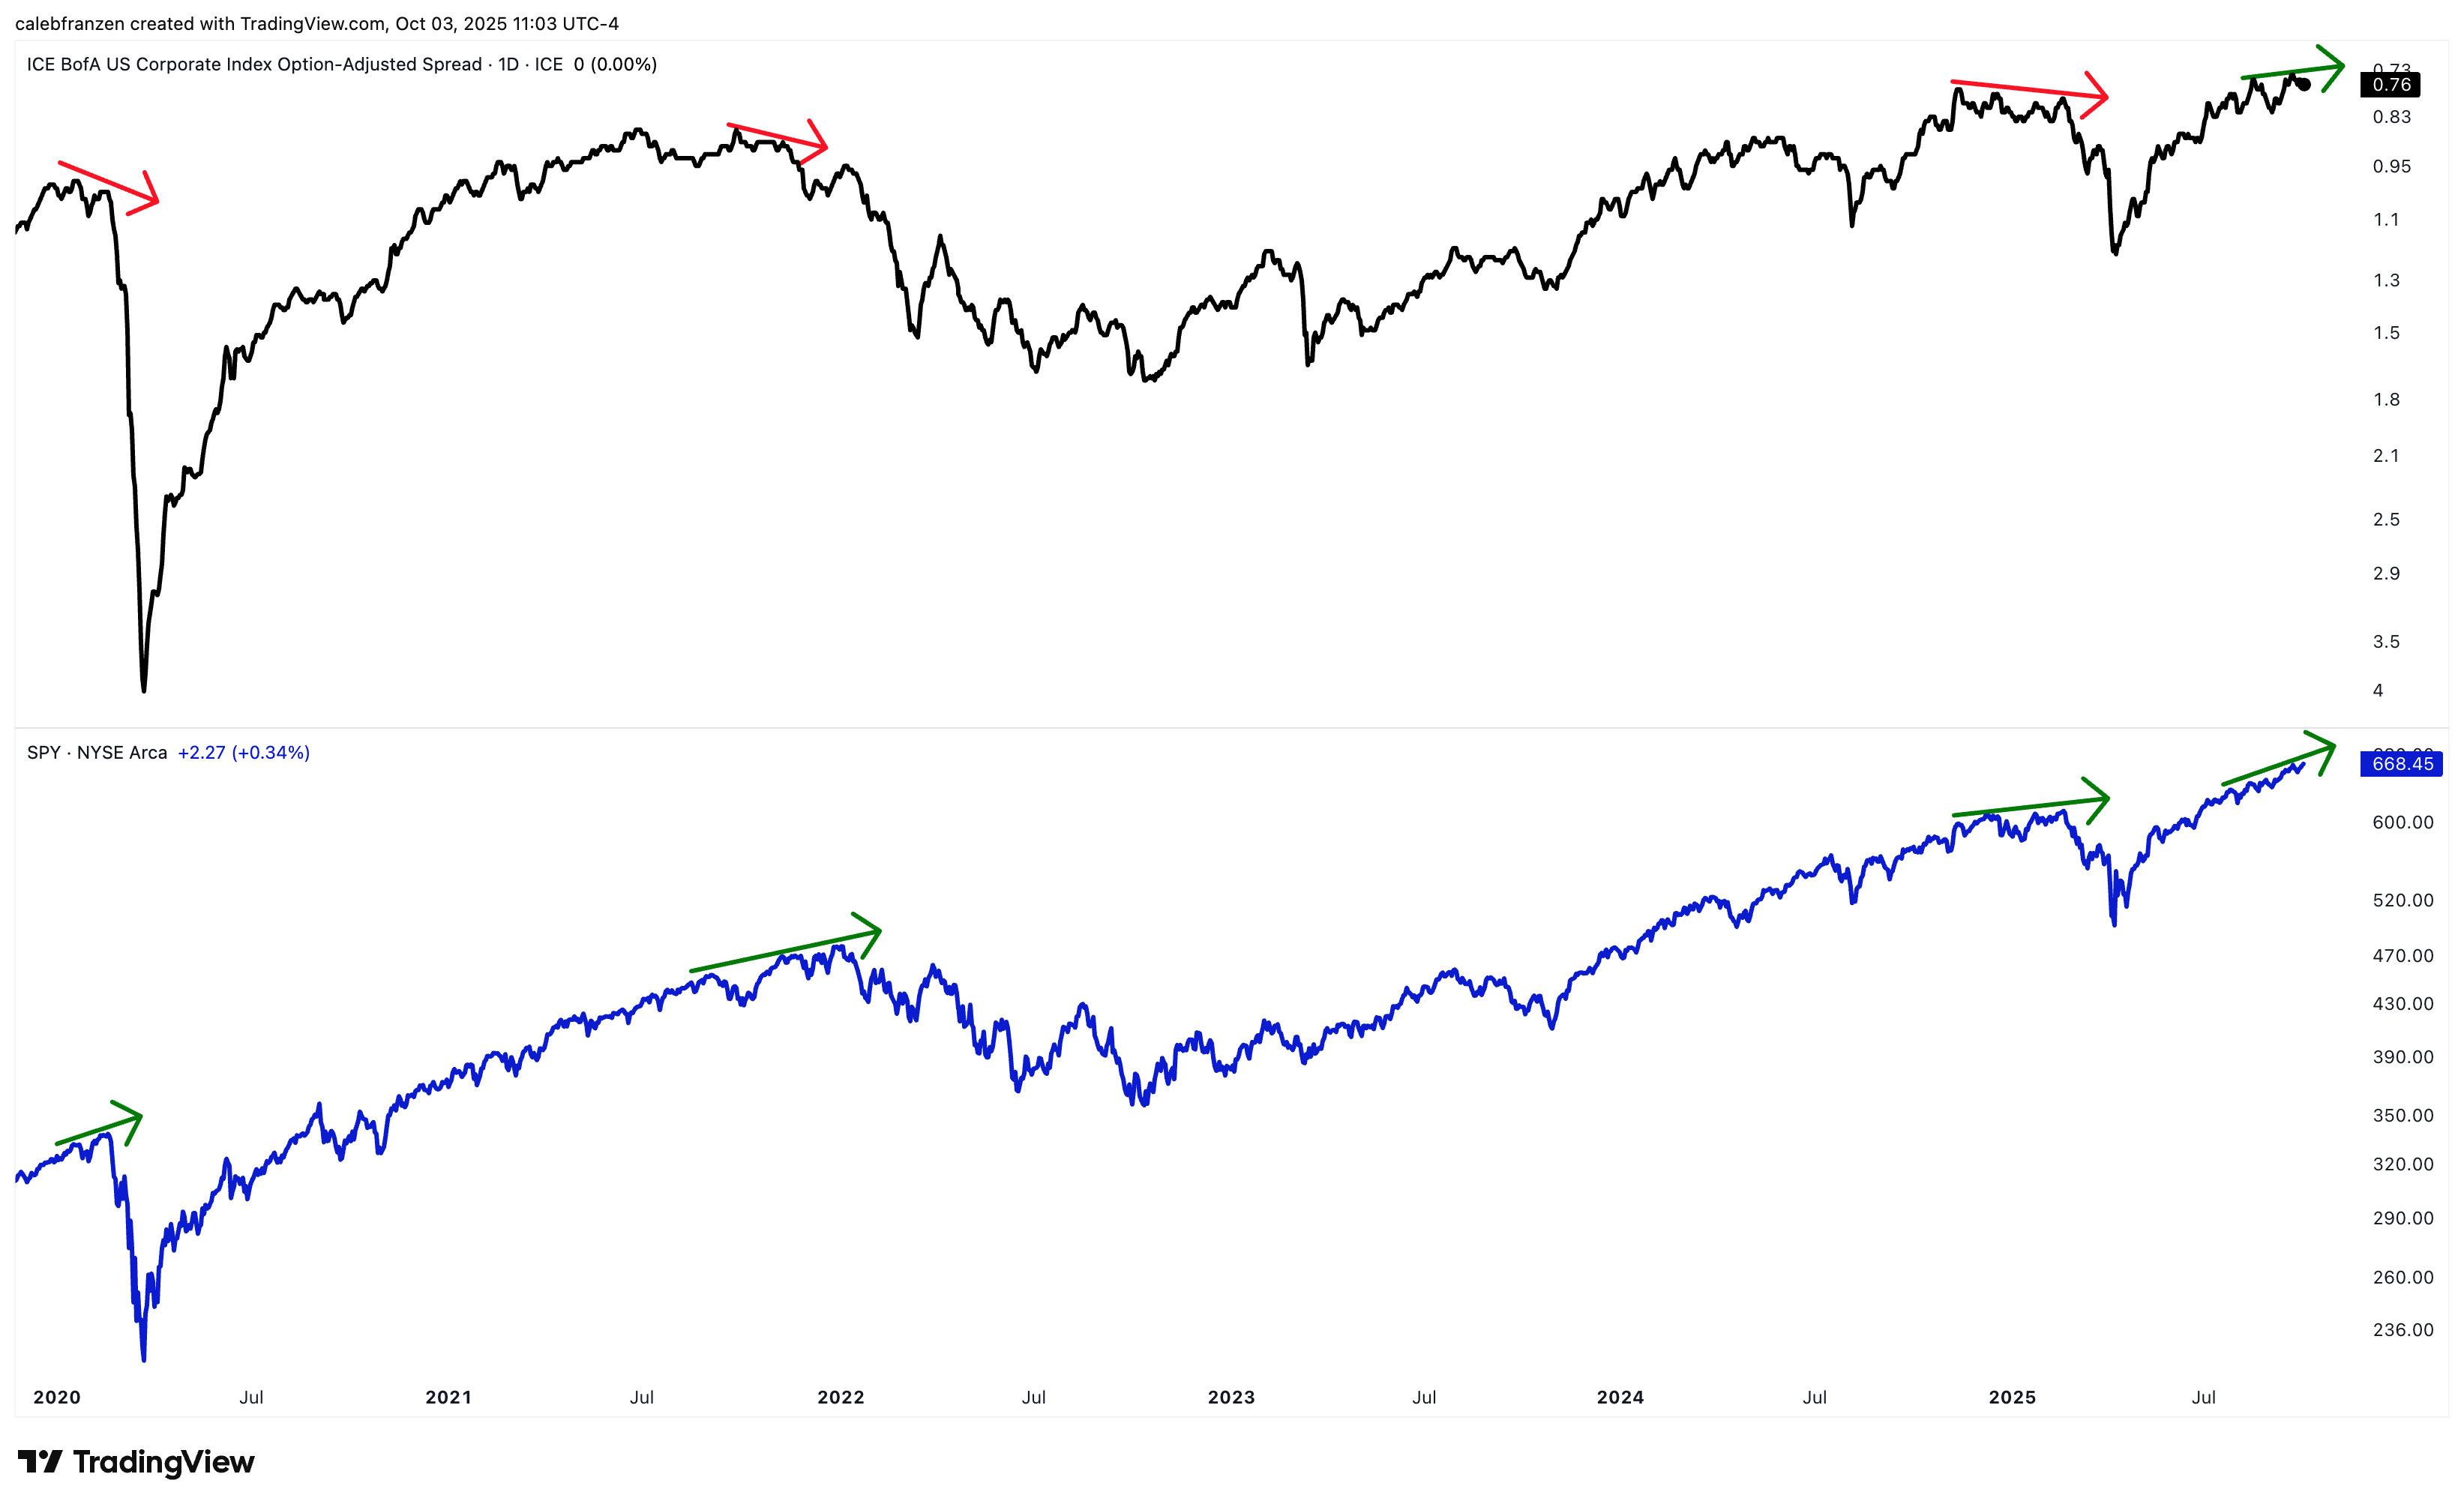
When spreads diverge vs. the S&P 500, we typically see bad things take place.
This is something that I was warning about in real-time in Q1’25.
Is it happening today?
Nope.
In other words, the credit market is confirming the uptrend in equities & Bitcoin!
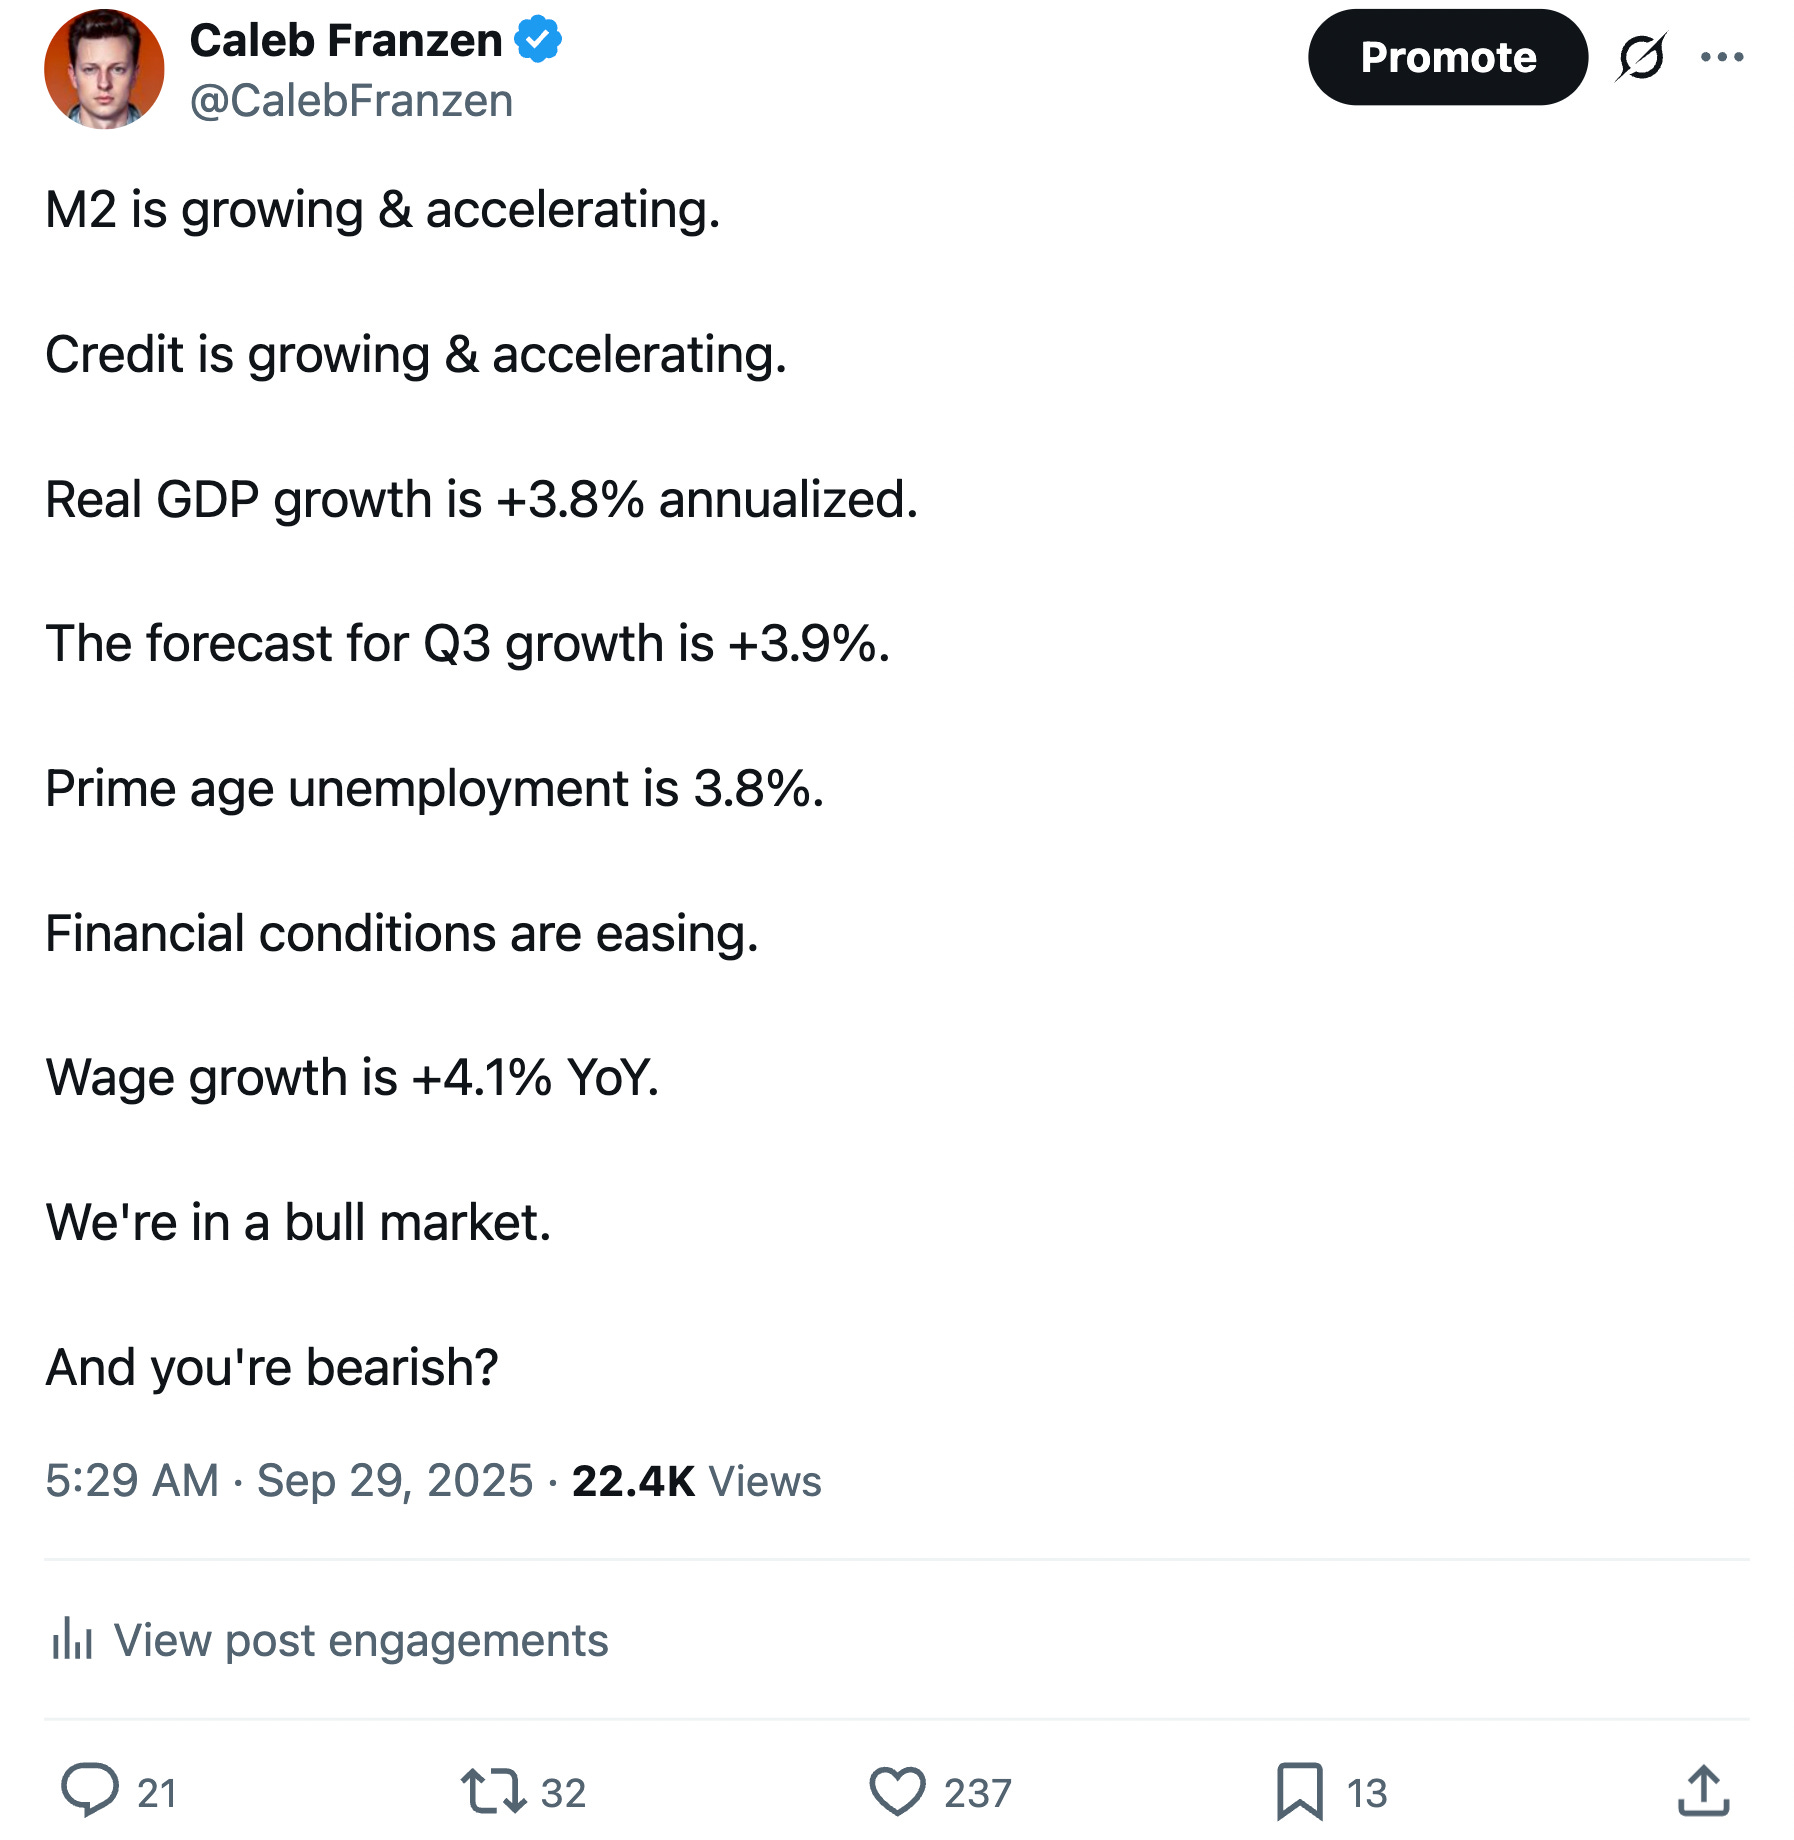
As I recently highlighted on X, we have prime conditions to support the bull market:
With Bitcoin surging back to the all-time highs (priced in USD), while making new ATHs priced in Canadian Dollars, British Pounds, and Japanese Yen, I think it’s vital for investors to recognize that the weight of the evidence points to more new highs.
Strength begets strength.
It’s our responsibility as investors to do everything we can to align with that.
Best,
Caleb Franzen,
Founder of Cubic Analytics
This was a free edition of Cubic Analytics, a publication that I write independently and send out to ~14,000 investors every Saturday. Feel free to share this post!
To support my work as an independent analyst and access even more exclusive & in-depth research on the markets, consider upgrading to a premium membership with either a monthly or annual plan using the link below:
There are currently 1,100+ investors who are on a premium plan, accessing the exclusive alpha and benefits that I share with them regarding the stock market, Bitcoin, and my own personal portfolio.
DISCLAIMER:
This report expresses the views of the author as of the date it was published, and are subject to change without notice. The author believes that the information, data, and charts contained within this report are accurate, but cannot guarantee the accuracy of such information.
The investment thesis, security analysis, risk appetite, and time frames expressed above are strictly those of the author and are not intended to be interpreted as financial advice. As such, market views covered in this publication are not to be considered investment advice and should be regarded as information only. The mention, discussion, and/or analysis of individual securities is not a solicitation or recommendation to buy, sell, or hold said security.
Each investor is responsible to conduct their own due diligence and to understand the risks associated with any information that is reviewed. The information contained herein does not constitute and shouldn’t be construed as a solicitation of advisory services. Consult a registered financial advisor and/or certified financial planner before making any investment decisions.
Each investor is responsible to understand the investment risks of the market & individual securities, which is subjective and will also vary in terms of magnitude and duration.
Fantastic stuff Caleb!
Good charts man appreciate the work 👍🏻👍🏻